Coronavirus Analysis: Will Social Distancing Help Prevent the Spread?
Introduction
We are in the midst of a global crisis. The coronavirus, or COVID-19, has officially been declared a pandemic and it is wreaking havoc across the globe. Countries are getting shut down, economies are severely affected and the stock market is crashing to the ground.
The coronavirus, or COVID19, has swept into at least 114 countries and is spreading to more countries, prompting concerns about how contagious the virus is and how it spreads.

Given that we now have a bit of time on our hands, I wanted to use this to understand if there’s a correlation between working from home and the spread of the coronavirus. As a member of the data scientist community, I go with logical quantitative estimates rather than qualitative estimates. This triggered me to do some research on this topic.
My aim here is to answer why we need to strictly follow social distancing to control the spread of Coronavirus with the support of available data.
I have analyzed the disease outbreak using the data hosted by John Hopkins University which is updated on an hourly basis. The data source contains three files – Total Confirmed Cases, Deaths and Recoveries. From this data (till March 22, 2020), I plotted how the cases grew over time from the starting day of outbreak i.e. from the day when the first case is reported.
Here’s What We’ll Look At:
- Top 10 Affected Countries
- Current Coronavirus Situation in India
- Is Social Distancing the Right Measure to Stop the Spread?
- Learning From the 1918 Flu
- Global Epidemic and Mobility Model (GLEAM) Estimate on China with Travel Ban
- Estimating the Impact of Social Distancing in the US in the Coming Days
- Model Virus Transmission with Social Distancing in the US
Top 10 Affected Countries

The graphs clearly show how the outbreaks grew exponentially after crossing the ‘outbreak’ threshold. This triggers a strong signal to every country about the intensity of the situation. If not taken seriously, the coronavirus cases can compound quickly and the growth is almost exponential so even a small number of cases could balloon into a full-blown outbreak very fast.
For instance, Italy took 23 days to cross 100 cases and just 13 more days to cross 5000 cases and is now at 53,578. Likewise, the US seems to be following the same pattern. It took 41 days for the US to cross 100 cases and just took 14 days to cross 6000 cases and now stands at 25,489. Currently, the US appears to have an even worse trajectory than Italy.
Current Coronavirus Situation in India
The world’s second-largest populated country India took 44 days to cross 100 cases and is now at over 400 cases. The virus spread growth post 100 days as compared to other top countries (in terms of virus transmission) in India seems to be in better shape.
Is it because of the early and serious implementation of social distance measures? India reported its first restriction of a travel ban on international arriving passengers starting from Mar 13, 2020, when it had 82 confirmed cases.

Is India not testing enough cases? Is that where we are missing the exact spread growth? The assumption is the disease has still not spread in the community. The country tested 826 samples collected from patients suffering from an acute respiratory disease from 50 government hospitals across India between 1 and 15 March.
Existing labs in India are able to provide results in six hours and each lab has the capacity to test 90 samples a day. The country is planning to increase its capacity to test 8,000 samples with the regular process and 1400 with rapid testing labs. So, to clearly analyze disease spread and model the Indian scenario, we need to wait for a couple of weeks.
Is social distancing the right measure to stop the spread?
Preliminary analysis suggests that the key influencing factor for the rise in cases across the globe is disease spread. Those with the virus can unknowingly infect others before symptoms appear, some as soon as two days after infection. Patients are able to spread the infection until they recover.
According to the “Estimating the generation interval for COVID-19 based on symptom onset data” report, the proportion of pre-symptomatic transmission was 48% (95% CI 32-67%) for Singapore and 62% (95% CI 50-76%) for Tianjin, China.
There is one very simple thing we can do that works in reducing spread – social distancing. The idea is to reduce person-to-person contact in order to make spreading the disease less likely. This could ensure that there are sufficient resources available for a sick population, which in turn will help improve survival rates.

Learnings from the 1918 Flu Pandemic
The below chart shows the impact of social distancing in 1918 for the flu in the US. For example, a city like St. Louis took measures 6 days before Pittsburgh and had less than half the deaths per citizen. On average, taking measures 20 days earlier halved the death rate:

Global Epidemic and Mobility Model (GLEAM) Estimate on China with Travel Ban
The GLEAM model generates an ensemble of possible epidemic scenarios described by the:
- Number of newly generated infections
- Times of disease arrival in each subpopulation, and
- Number of traveling infection carriers
The below chart shows the impact that the Wuhan travel ban had on delaying the epidemic. The bubble sizes show the number of daily cases. The top line shows the cases if nothing is done. The two other blocks show decreasing transmission rates. If the transmission rate goes down by 25% (through Social Distancing), it flattens the curve and delays the peak by a whole 14 weeks. Lower the transition rate by 50%, and you can’t see the epidemic even starting within a quarter.

There are many companies like Google, Microsoft, Verizon and others that are encouraging social distancing policies. As per this link, 790+ companies are currently encouraging social distancing.
Impact of Social Distance on the US in the Coming Days – Statistical Simulation Estimate
The Susceptible (S) Exposed (E) Infected (I) Removed (R) model is one of the most widely used models for modeling how a disease spreads through a population. The model is an extension of the SEIR differential equation epidemic model with the inclusion of exposed.
- Susceptible: Individual is able to become infected
- Exposed: Individual has been infected with a virus, but due to the virus incubation period, is not yet infectious
- Infectious: Individual is infected with a virus and is capable of transmitting the virus to others
- Recovered: Individual is either no longer infectious or “removed” from the population

In the SEIR model, the population is classified into one of the compartments mentioned in the above figure. Compartmental models are governed by a system of differential equations that track the population as a function of time, stratifying it into different groups based on risk or infection status.
The independent variable used in the model is time, measured in days. The dependent variable of interest is a fraction of the total population in each of the four compartments.
The data is simulated using the Euler method i.e. at any given point (t, y), the method will calculate dx/dt. The sequence of x-values like x0, x1, x2, x3 and so on are generated using this method. Starting from a given x0 and computing each rise as slope x run:
xn = xn-1 + slopen-1 Delta_t
where Delta_t is a suitably small step size in the time domain.
For the SEIR model, the dependent variables are s, e, I and r. Now, the four Eulers of the form:

SEIR models ordinal differential equations:

Here, N =S+E+I+R. N is a constraint that indicates there are no birth/migration effects in the model; the population is fixed from beginning to end.
For SIR equations, the final Euler formulas will be:

The following parameters are required to simulate the scenario:
- Beta is the inverse of the incubation period (1/incubation days(5.2 days))
- Alpha is the average contact (infection) rate in the population – 2.2
- Gamma is the inverse of the mean infectious period (1/infectious days(2 days))
- US Population: 331,002,651 (Mar 22, 2020 Estimate)
Model-Virus Transmission without Social Distancing in the US
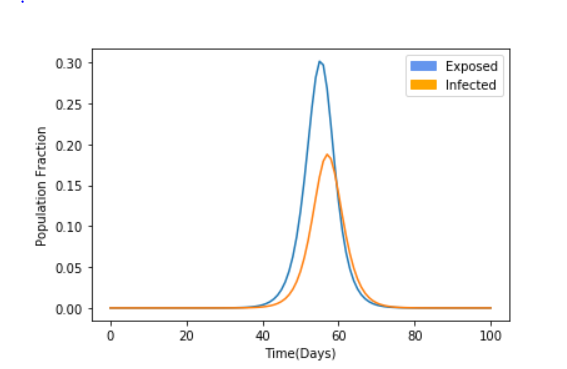
Without social distancing, the base model suggests 18% of the US population will be infected with the disease after 40 days from the first exposure, which clearly triggers the warning signal.
Model-Virus Transmission with Social Distance in the US

Adding ρ (encounter rate) to the model to capture the social distancing effect. The value of ρ ranges from 0 to 1, where 0 indicates everyone is locked down and quarantined while 1 is equivalent to our base case.
Considering a scenario of cutting the encounter rates by 50% (through social distancing policies) clearly shows the virus transmission in the above graph has come down to approximately 3%. We can generate different scenarios by modifying all configurable parameters like ρ, incubation period and other things.
Final Thoughts
Coronavirus cases’ exponential growth shows us that we need to strictly follow social distancing measures to protect ourselves and others. Early signs presented in Graph 1 are showing that spread has come to control in China and South Korea. China experienced a period of exponential increases in COVID19 cases but that seems to be leveled out.
China started taking severe restrictive lockdowns and quarantines on its cities starting from Jan 23, 2020. Despite these extreme measures, it took almost about 30 days and an additional 80,000 cases before the curve flattened out. That’s the cost of delaying or not following social distance measures.
About the Author


Hello! Very interesting analysis. I few days ago I read an article about the context and the many decision countries take without information. This analysis is a very usefull tool to confirm if the country took the correct decision. In my opinion there is a lot of opportunities to study, for example is it necesary the social distancing for all the population or we can get the same result you share if we isolate only the risk population. And with this assumption we have another opportunitie to work with clusters to define who is in the risk population. Thank you! Regards,
Very nice work. If you have time, could you edit the article to tell us which plotting software was used for each graph?
Very nice Analysis Tilak.