Data Science: Automotive Industry-Warranty Analytics-Use Case
This article was published as a part of the Data Science Blogathon.
Introduction
The automotive industry has mobilized the economy for decades. In the Automobile industry, the value chain starts at Inbound Logistics (raw material, warehouse) Production (Operation), Marketing and Sales, Maintenance (Service) given the Car design, vendors, the process is already ready.
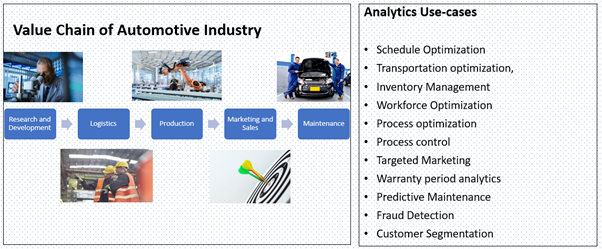
Though Data science is used at all levels in this value chain like optimization the schedule, transportation optimization, inventory management, workforce optimization, process optimization, and process control, targeting the right audience for the right segment of car, today I will be describing more on Maintenance or Warranty period analytics use case I have worked on.
Why Warranty Analysis?
After-sales, automobiles get post-sale services from dealers. A warranty analysis is mainly based on the data collected from those services, claims over a certain period.
In the Warranty Analysis typically Gamma, Weibull, or lognormal Distribution is observed for the failure of the product over the period.
How Does Warranty Analysis Data look like and how do we fit the distribution to data?
A warranty analysis is the analysis of time-to-event/failure data. In our example, the individual part is followed from the car sold time to its failure.
As in typical model building, we split the data into train and test datasets. With the training data, we first estimate the parameters of the distribution, and then using test data, we see if the model fitted works well on that data or not.
Gamma: The probability density function (pdf) of the Gamma distribution can be expressed as:
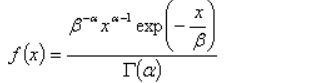
Gamma Distribution
with α >0 and β >0 and x ≥0.
This also means it has two parameters, alpha– which represents the shape parameter, and beta- which represents the scale parameter, and its support consists only of positive values.
In Gamma distribution, using all xi ‘s, and using Maximum likelihood estimates, I estimated the α and β for each item(spare part in analysis). But I observed that Gamma distribution when fitted on test data, the actual time to fail was not close to the predicted time to fail by model for that item. So I discarded the Gamma Distribution approaches.
Weibull: The probability density function (pdf) of the Weibull distribution can be expressed as:
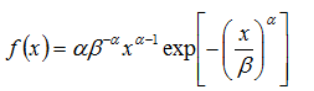
Weibull Distribution
with α >0 and β >0 and 0 < x < ∞
This means, it has two parameters, alpha– which represents the shape parameter, and beta- which represents the scale parameter, and its support consists only of positive values.
Again here using the maximum likelihood estimate for each spare item’s data I estimated α and β and tested with test data. The accuracy of the time to fail for each item was on test data with the estimated α and β for all items were in acceptance criteria. and hence all the items of cars were modeling using Weibull distribution. For each item, I had different α and β, and all those models were stored for scoring purposes for the future.
The scenarios under which conditions the car is driven, driver’s driving skills, the age of the part are a few of the parameters of which some can be measured, and some are qualitative. And hence the modeling of the item failure needs to be done on a large amount of data. Else model will have a bias from the modeling data and the accuracy of the model will drop over the period of deployment /implementation.
Challenges: Typical challenges would be the accuracy and timeliness of data, the length of historical data, the number of parts to be modeled, and model selection based on accuracy on testing data. In my analysis I had the last two challenges due to the reasons like the car will have 1000’s of items in it and the model which fits best for one item may not fit well for another item.
Solution: There are many research papers that have explained this problem, mentioned the three distribution is way forward. To the problem, I was solving Weibull distribution fit well to all the part items. Once that is fit, testing data should support the model chosen and once that is done, I developed the process so that each item is modeled, and its scoring function is stored in such a way that periodically the forecast of failures per item is generated.
Once this solution is implemented in the business process, every month, manufactures will have an estimate of which items and their count he needs to be ready with for possible warranty claims. This enables saving in customer wait time for parts to be available, better inventory management, reduction in the cost of unnecessary storage of non-required parts and check on fraudulent warranty claims too.
Conclusion: For every manufacturer, warranty analytics can solve the following problems:
- Identify the patterns of claims (based on season, mileage, etc)
- Predicting the expected number of claims or cost of claims
- Predicting fraudulent claims( particular dealer always filing warranty claims, the life of an item is very long, but those
parts are frequently coming for a warranty claim, etc) - Investigating the association between different types of claims ( the two spare parts that get used same time has the
same failure time) - Identifying issues before they become severe and stop functioning
- What-if analysis such as if we increase the mileage what will impact on warranty costs
The benefits of the warranty analytics are:
- Increased customer satisfaction, product quality & brand reputation
- Tremendous impact on the bottom line due to early issues identification
- Optimized warranty policies for maximum financial performance
- Increase efficiency of support logistics such as optimum stocking of replacement parts or deployment of technicians.
It can also help answers the questions like:
- If we can raise the product warranty from 3 years to 6, if data supports the failure of the product occurs only after 10 years. If a competitor has raised his warranty and if we do adopt the same, how much more warranty costs we will incur? If we don’t, how much revenue we will we lose from reduced market share?
- Given a new product with no historical data, should we play it safe and offer only a one year warranty, or can we offer a three-year warranty to improve our brand perception?
This article summarizes the background, solution approach, and benefit for Warranty analytics which is a very big industry due to the increase in the sale and competition in the automobile market.
The media shown in this article are not owned by Analytics Vidhya and is used at the Author’s discretion.


