Building the Ultimate Sales Dashboard
We all know that data is the key to actionable decision making. In a fast-paced job like sales, you are surrounded by it. From gathering customer data to monitoring sales status to tracking goals, salespeople are collecting and using data at every possible minute.
The challenge with having all of this data at your fingertips is organizing it. Without the right strategy and business intelligence tool in place, you are not able to derive meaningful insights from the data you work so hard to accumulate. This is where sales dashboards have proven to be highly effective.
In sales, dashboards play a huge role in managing day-to-day operations, measuring performance, and adapting quickly to changing conditions. With a well-organized dashboard designed to meet a specific goal, a sales manager can take a glance at key metrics on a single screen and make speedy decisions based on facts.
If you’re looking for a better way to track your sales team’s progress and meet your revenue targets faster this year, Jet Global can help. Business intelligence (BI) is our specialty, and we have had a lot of experience working with top performing sales organizations and ambitious teams looking to get more value from their data.
To set you up for success in analytics, we have created a quick guide on how to create the ultimate sales dashboard. Keep reading for more insight on the sales metrics you should be tracking and the dashboards you should be using.
Pinpoint the Purpose of Your Sales Dashboard
It may seem a little simple but the first step to building a great sales dashboard is to identify who will be using this dashboard, how they will be using this dashboard, and what information they want to see. A sales rep might want a graphic dashboard that they can check daily to help meet their weekly goals. A sales manager might be after a more detailed dashboard to check top performing sales reps every week. On the other hand, a sales VP might need just a simplified dashboard to show high-level revenue and sales every month.
Generic dashboards are not as effective as specific, tailor-made dashboards so make sure you are clear on the purpose behind your sales dashboard before diving in.
Sales Metrics You Should Be Tracking
A day in the life of a top salesperson orbits around meeting sales targets and quotas. From tracking phone calls to nurturing prospects to closing deals, sales teams are in a constant state of flux. Before building your sales dashboard, you need to identify your top goals and narrow down what KPIs and metrics are most important in reaching those goals.
Sales goals depend on who you are and what you do. A sales manager is going to have different goals from an inside sales rep. A go-getting sales manager might set a goal of increasing sales by 5% this quarter, and therefore needs to monitor both individual and team performance to track progress and identify their top performers. An inside sales rep’s goal is to reach a target of 200 cold calls per month, so they are focused on tracking sales activities and completing tasks: two very different goals, two very different dashboards.
A golden set of sales metrics and KPIs doesn’t really exist, as measurements differ from department to department. The general rule of thumb when choosing your KPIs and metrics is to tie it back to your goal. If it gives you useful information and identifies areas for improvement, you should track it.
According to an informative article by HubSpot, sales metrics typically fall into one or more of these categories:
- Activity Sales Metrics (Ex. # of calls made, # of meetings scheduled)
- Pipeline Sales Metrics (Ex. Average length of the sales cycle, total closed opportunities by month/quarter)
- Lead Generation Metrics (Ex. Average lead response time, % of qualified leads)
- Sales Outreach Metrics (Ex. Email open rate, engagement rate)
- Primary Conversion Metrics (Ex. % of opportunities closed/won)
- Channel Sales Metrics (Ex. Revenue by partner, Average deal size by partner)
- Sales Productivity Metrics (Ex. % of time spend on selling activities or creating content)
- Sales Process, Tool, and Training Adoption Metrics (Ex. Average cost of training by salesperson)
The bottom line is that the ultimate sales dashboards need to be designed for a specific person with specific goals. A dashboard that tries to include all of these sales metrics is not going to effective or particularly useful to anyone. It needs to relevant, easy to read, and easy to adjust.
Build Your Sales Dashboards with Business Intelligence Software
Once you have your goal and metrics identified, you’re ready to start building your sales dashboard. You may have these capabilities built into your CRM or ERP solution, but most of the time, they are not the most user-friendly tools. There are a ton of separate dashboard solutions out there to choose from, but we usually recommend you stick with a business intelligence (BI) solution that integrates with your current software, for a few reasons in particular:
- BI software is designed for self-service reporting and analytics – that means you shouldn’t need a developer every time you want to build or alter a dashboard
- Data consolidation will be automated, ensuring real-time information from multiple data sources. This is super important!
- BI software comes with lots of great pre-built dashboard and chart options to choose from
- BI software gives you the ability to drill down into key information and apply calculations within the tool itself
Once you have your BI solution implemented, you will be able to automatically pull any data into your dashboard and use it for decision making. You can create dashboards and reports to track sales performance, identify sales opportunities, create sales forecasts, analyze your pipeline, and more.
If you decide against a BI solution or separate solution that syncs with your ERP system, this will be a more manual and time-consuming process. This option means you have to build reports and dashboards from scratch and constantly update them, but there are Excel templates out there for that.
Create, Visualize, and Share Your Sales Data
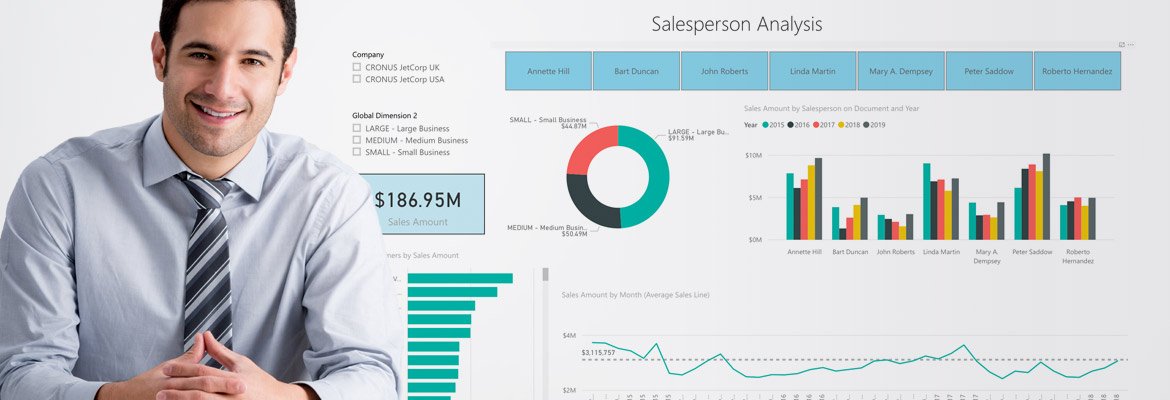
The purpose of a dashboard is to be able to make decisions at a glance. That’s why the most useful sales dashboards are easy-to-read and understand. BI software includes a wide range of templates to choose from and charts to visualize your data. Pie charts, bar charts, line charts – any kind of chart you can think of – will help you customize the tiles on your dashboard to your personal preferences. That being said, you don’t want to overwhelm your user with too many fancy charts and clutter.
There are a few design conventions to keep in mind before diving into your dashboard. The first is simplicity and usability. Color, images, buttons, fonts, charts, numbers – every element of a dashboard should look and feel consistent to the user, so there is no confusion or issues with navigation. Another thing to keep in mind is that most of us read from left to right. You want these dashboards to lead to quick interpretation and fast responses, so putting the most pertinent visuals on the left will help. Just remember that everyone is different, so it’s a good idea to experiment a bit with these options to find what colors and charts work best for you and your team.
The other thing to keep in mind when building your dashboards is how you will access and share them. If you’re creating a sales leaderboard dashboard, for example, you want every member of the team to be able to view this dashboard from anywhere with an internet connection, easily.
10 Best Practices to Building Effective Dashboards
If you are serious about creating meaningful dashboards for your sales team, download our latest white paper on KPI dashboards! We go into more detail about what kinds of dashboards are the most effective for quick, informed decision making and include some important best practices that will help you reach your sales quotas faster!