
Any viewer with a passing interest will (or should) want to know more, drill deeper, and ask “why?”.
The one-page dashboard was once the predominant form of visualizing data. It was the standard and the expectation. With touch screens, mobile devices, on-demand data, and interfaces crafted for interaction and user experience, the one-page dashboard is a relic. Use cases for one-page dashboards exist, but they are increasingly rare.
One-page dashboards came from the best of intentions: The objective was to provide an audience with a single view that showed all the key information together. In this way, the viewer could monitor important data and see where performance was good or bad, all at a glance with the necessary context.
A lot has changed since this type of dashboard was considered the peak of dashboard design (no offense to Jason Lockwood who did a great job within the confines of this exercise):

http://www.perceptualedge.com/blog
The admirable use of color and layout cannot overcome the misguided one-page constraint and disconnect from the needs of the viewer. You have to ask whether this form serves basic needs:
Can I see all the important information at a glance? While there is a lot of information, not all the useful detail finds a place (axis scales, for one thing). Worse, the volume of information is difficult to absorb with the exception of the person who is very experienced with the data.
Can you quickly spot the issue areas? The red dots are a start. But they skim the surface of the concerns that could be highlighted. And what if my definition of “concerns” changed based on the viewer's perspective? Furthermore, the viewer gets no guidance as to why certain items are highlighted and what they might do about it.
There is a broken assumption for one-page “monitoring” dashboards: seeing a problem (with whatever data can be fit on the page) is enough for the viewer. It seldom is. Any viewer with a passing interest will (or should) want to know more, drill deeper, and ask “why?”. A dashboard must not pass on this inherent responsibility to help the viewer. Identifying problems isn’t enough. A good dashboard attempts to help solve those problems.
Jerome Cukier describes the goal of purpose of dashboards:
“It’s about putting the needs of your users first...What is something that your users would try to accomplish that could be supported by data and insights?”
The one-page dashboard is “a man without a country.” It tries to do too much for an executive who would much rather get an alert for the two problem areas...or at least more guidance about the meaning and relevance of what they are seeing. For someone who wants to engage more deeply with the data, the one-pager offers far too little. If done well, it only starts the conversation.
Changes in technology also undermine the premise of single-page dashboards. Trends in how we interact with information mean there isn’t a need to cram all the information together:
The scrolling myth. A decade ago, asking users to scroll was nearly a sin. That’s no longer the case. Touch screens, mouse-scroll wheels, and gestures have made it easy and natural to move vertically on a screen. These interaction models have elongated what user experience designers consider a single screen. Our online experiences are entirely navigated through vertical scrolling. Scrolling acts as a form of guided gradual reveal.
The power of dynamic interfaces. It was once a fair assumption that a dashboard would be a static snapshot of data, lacking the ability for users to interact with the content. Excel was the tool of choice and it took advanced Excel skills to make it interactive. Today dashboard building tools offer features for connecting key metrics to details that help explain reasons behind changes or outliers.
The limits of attention. The information age has become the (limited) attention age. Mobile apps, smartwatches, and voice-activated interfaces recognize the need to deliver only the most critical information at the right time and let the user ask for more. The person provides context and desires; the computer provides notifications and answers. This new model of information exchange is at odds with the one-page dashboard. It is unreasonable to expect someone to stare deeply into the densely packed digits and sparklines of a one-page dashboard. There are better ways.
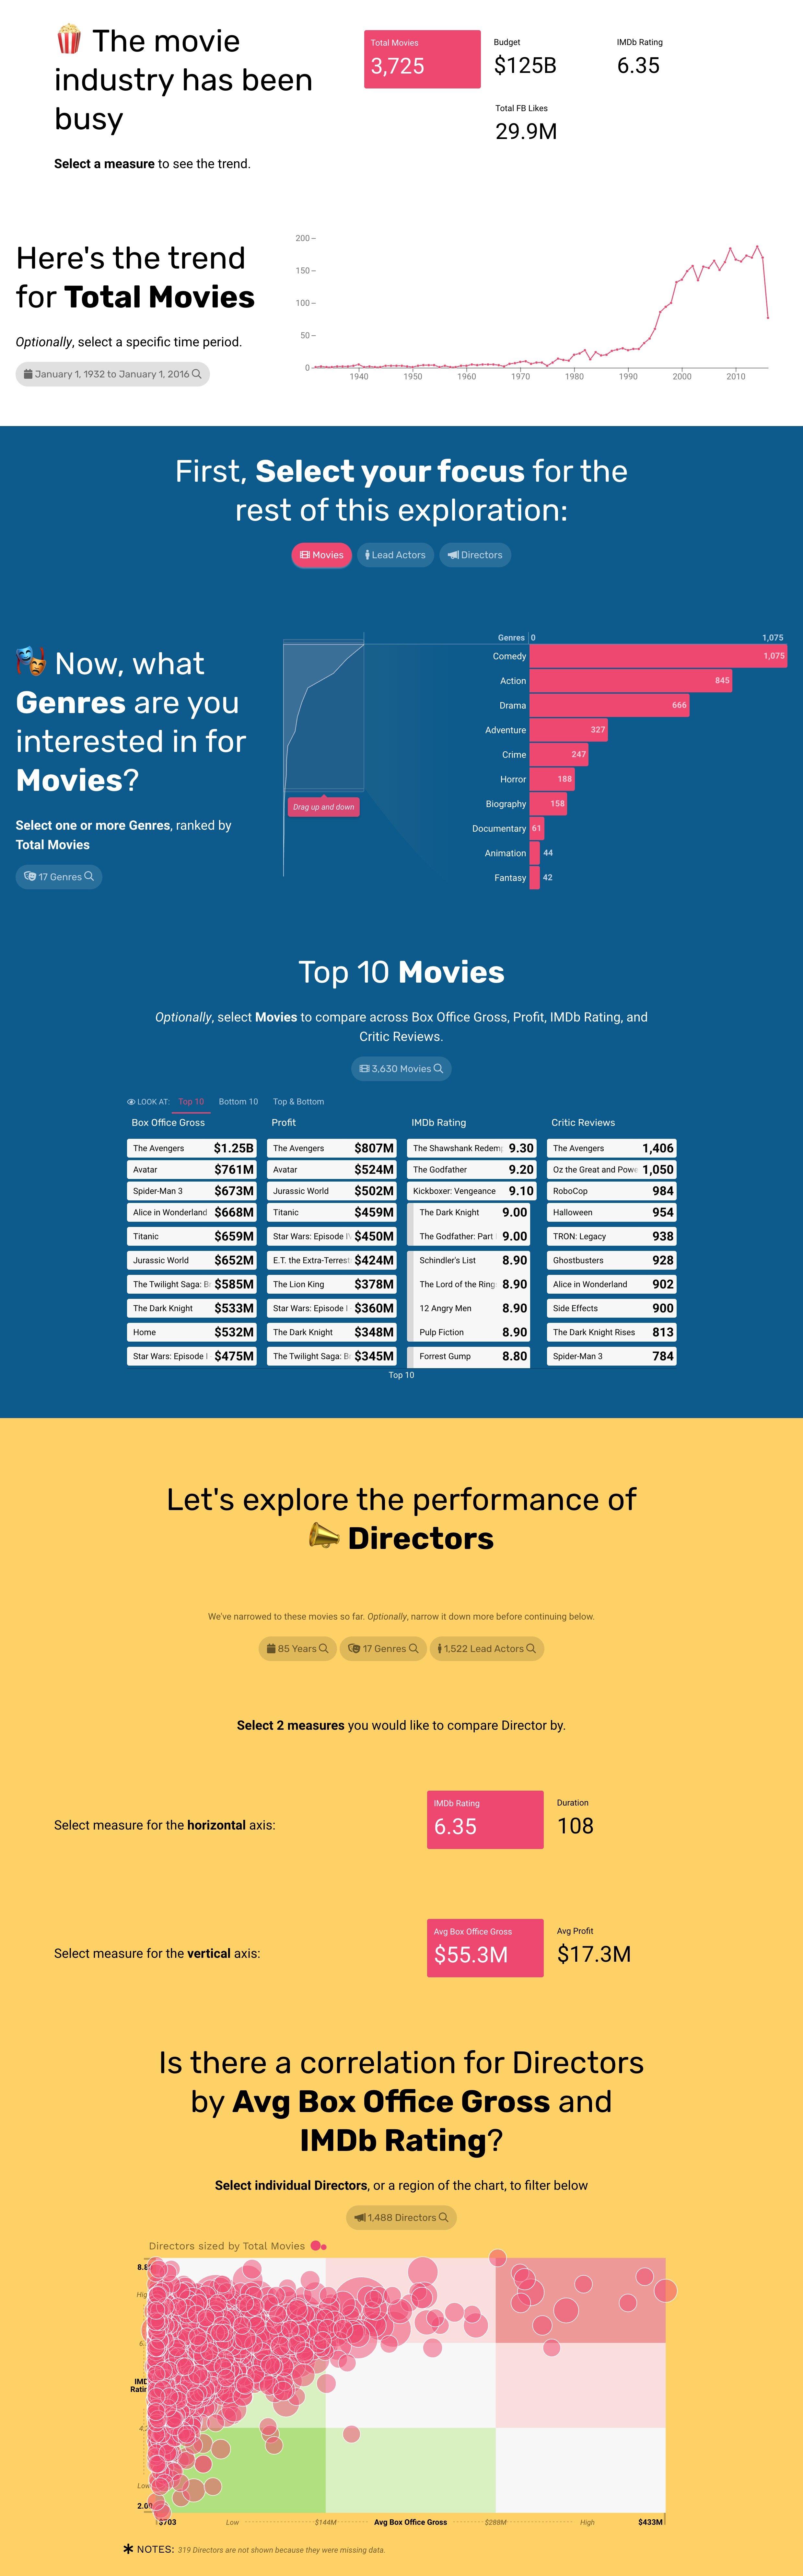
Scrolling-style dashboard
Nevertheless, the goal of the one-page dashboard remains: How to show viewers the big picture and understand it in context? How to encourage people to connect the dots across different data points? Modern interfaces have brought us better means to these ends.
Often there isn’t a meaningful distinction between dashboards to monitor and dashboards to understand. Monitoring highlights problems — and should flow seamlessly into the analysis of the root cause.
The best dashboards do even more: they guide viewers to details that are actionable, tell viewers what actions can be taken, and enable discussions between colleagues. All this doesn’t happen on a single page.