A Beginners’ Guide to Image Similarity using Python
This article was published as a part of the Data Science Blogathon.
Introduction
Have you ever dreamt of building your own Image Similarity Application but are scared that you don’t know enough of Deep Learning, Convolutional Neural Network, and more? Do not worry. The following tutorial will help you get started and help you code your own Image Similarity Application with basic mathematics.
Before we jump into maths and code I would ask you a simple question. Given two reference images and one test image, which one do you think our test image belongs two :
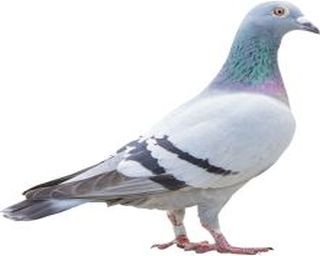
Reference Image 1
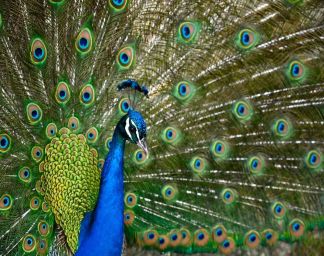
Reference Image 2
Test Image
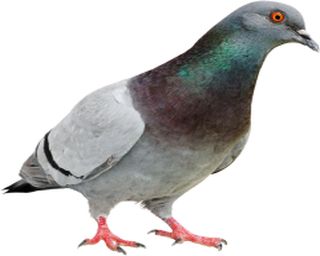
If you believe that our Test Image is similar to our first reference image you are right. If you do believe otherwise then let’s find out together with the power of mathematics and programming.
“The future of search will be about pictures rather than keywords.” — Ben Silbermann, Pinterest CEO.
Image Vector
Every image is stored in our computer in the form of numbers and a vector of such numbers that can completely describe our image is known as an Image Vector.
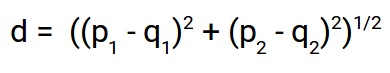
Euclidean Distance:
Euclidean Distance represents the distance between any two points in an n-dimensional space. Since we are representing our images as image vectors they are nothing but a point in an n-dimensional space and we are going to use the euclidean distance to find the distance between them.
Histogram:
A histogram is a graphical display of numerical values. We are going to use the image vector for all three images and then find the euclidean distance between them. Based on the values returned the image with a lesser distance is more similar than the other.
To find the similarity between the two images we are going to use the following approach :
- Read the image files as an array.
- Since the image files are colored there are 3 channels for RGB values. We are going to flatten them such that each image is a single 1-D array.
- Once we have our image files as an array we are going to generate a histogram for each image where for each index 0 – 255 we are going the count the occurrence of that pixel value in the image.
- Once we have our histograms we are going to use the L2-Norm or Euclidean Distance to find the difference the two histograms.
- Based on the distance between the histogram of our test image and the reference images we can find the image our test image is most similar to.
Coding for Image Similarity in Python
Import the dependencies we are going to use
from PIL import Image
from collections import Counter
import numpy as np
We are going to use NumPy for storing the image as a NumPy array, Image to read the image in terms of numerical values and Counter to count the number of times each pixel value (0-255) occurs in the images.
Reading the Image
We can see that out image has been successfully read as a 3-D array. In the next step, we need to flatten this 3-D array into a 1-Dimensional array.
flat_array_1 = array1.flatten()
print(np.shape(flat_array_1))
>>> (245760, )
We are going to do the same steps for the other two images. I will skip that here so that you can try your hands on it too.
Generating the Count-Histogram-Vector :
RH1 = Counter(flat_array_1)
The following line of code returns a dictionary where the key corresponds to the pixel value and the value of the key is the number of times that pixel is present in the image.
One limitation of Euclidean distance is that it requires all the vectors to be normalized i.e both the vectors need to be of the same dimensions. To ensure that our histogram vector is normalized we are going to use a for loop from 0-255 and generate our histogram with the value of the key if the key is present in the image else we append a 0.
H1 = []
for i in range(256):
    if i in RH1.keys():
        H1.append(RH1[i])
    else:
        H1.append(0)
The above piece of code generates a vector of size (256, ) where each index corresponds to the pixel value and the value corresponds to the count of the pixel in that image.
We follow the same steps for the other two images and obtain their corresponding Count-Histogram-Vectors. At this point we have our final vectors for both the reference images and the test image and all we need to do is calculate the distances and predict.
Euclidean Distance Function :
def L2Norm(H1,H2):
    distance =0
    for i in range(len(H1)):
        distance += np.square(H1[i]-H2[i])
    return np.sqrt(distance)
The above function takes in two histograms and returns the euclidean distance between them.
Evaluation :
Since we have everything we need to find the image similarities let us find out the distance between the test image and our first reference image.
dist_test_ref_1 = L2Norm(H1,test_H)
print("The distance between Reference_Image_1 and Test Image is : {}".format(dist_test_ref_1))
>>> The distance between Reference_Image_1 and Test Image is : 9882.175468994668
Let us now find out the distance between the test image and our second reference image.
dist_test_ref_2 = L2Norm(H2,test_H)
print("The distance between Reference_Image_2 and Test Image is : {}".format(dist_test_ref_2))
>>> The distance between Reference_Image_2 and Test Image is : 137929.0223122023
Conclusion
Based on the above results we can see that the distance between our test image and our first reference image is much less than the distance between our test and our second reference image which makes sense because both the test image and our first reference image are images of a Piegon while our second reference image is of a Peacock.
In the following tutorial, we learned how to use basic mathematics and little programming to build our own Image Similarity predictor with pretty decent results.
The full code along with the images can be found here.
About the Author
My name is Prateek Agrawal and I am a third-year undergraduate at the Indian Institute of Information Technology Design and Manufacturing Kancheepuram pursuing my B.Tech and M.Tech Dual Degree in Computer Science. I have always had a knack for Machine Learning and Data Science and have been practicing it for the last year and have some victories to my credit as well.
I personally believe that Passion Is All You Need. I remember getting scared hearing people talk about CNNS, RNNs and Deep Learning because could not understand a single piece of it but I didn’t give up. I had the passion and I began taking baby steps towards learning and here I am publishing my first blog. I hope you enjoyed reading this and feel a bit confident about yourself. Trust me on this, if I can, you can.
Please ping me in case of any queries or just to say hi!
LinkedIn : https://www.linkedin.com/in/prateekagrawal1405/
Github: https://github.com/prateekagrawaliiit
Credits
- Wikipedia
- Analytics Vidhya
- Medium
- Google Images
The media shown in this article are not owned by Analytics Vidhya and is used at the Author’s discretion.


Thank you for sharing! I am looking for ways to quantify the similarity between images and it is very helpful :)