Pandas Visual Analysis – Interactive Visual Analysis
Introduction
“A visual always brings a first impression.” It’s a really appealing quote. It’s a fact that the human brain processes visual content 60,000 times faster than text😲. The same criteria work in the field of Data Science as well. The whole Data Science process is divided into 6 parts. Let’s see which are they.
- The Data Science Processes :
- Setting the research goal(Understand the problem statement).
- Retrieve Data.
- Preprocess the data.
- Explore the data using different Exploration Techniques.
- Creating a Model to solve our problem statement.
- Presenting our final result and solve real-time problems.
According to one survey, a Data Analyst spends more than 50% of the time(from total time to complete one project) in analyzing data. But don’t worry I will suggest to you one best libraries which will really help you and save you maximum time. Let’s look at that library.
Pandas Visual Analysis
It is a package provided by python for interactive visual analysis in jupyter notebook. It generates an interactive visual analysis widget to analyze pandas Data Frame. It can display various different types of graphs with support for linked-brushing in interactive widgets.
This allows data exploration and cognition to be simple, even with complex multivariate datasets. There is no need to create and style plots, it will automate the whole data exploration part. For more information, you can check out the documentation from here.
Installation of Pandas Visual Analysis Library
Using pip
pip install pandas-visual-analysis
Using Conda :
conda install -c meffmadd pandas-visual-analysis
To install this package from the source, clone into the repository or download the zip file and run :
python setup.py install
Let’s see the implementation in Python
Before looking at this beautiful library first we understand “Why actually the need for this library?” Many peoples really struggle with respect to exploratory data analysis that is the only reason but if the dataset is more complex then we can not use it. Let’s begin the coding part.
# import seaborn
import seaborn as sns
# lets look at the dataset available in seaborn
print(sns.get_dataset_names())
# OUTPUT :
# ['anagrams', 'anscombe', 'attention', 'brain_networks', 'car_crashes',
    'diamonds', 'dots', 'exercise', 'flights', 'fmri', 'gammas',
     'geyser', 'iris', 'mpg', 'penguins', 'planets', 'tips', 'titanic']
Let's use the iris dataset, I hope you all are familiar with the iris dataset or titanic dataset.
Dataset Description
It includes three iris flower species with 50 samples each as well as some properties about each flower. One flower species is linearly separable from the other two, but the other two are not linearly separable from each other. The columns in this iris dataset are:
- Id (Unique no. to each record)
- SepalLengthCm (sepal length of flower)
- SepalWidthCm (sepal width of flower)
- PetalLengthCm (petal length of flower)
- PetalWidthCm (petal width of flower)
- Species (species)
Lets import VisualAnalysis present in Pandas Visual Analysis library
# importing iris dataset
df = sns.load_dataset('iris')
# importing visualanalysis from pandas_visual_analysis library
from pandas_visual_analysis import VisualAnalysis
# visualizing different plots
VisualAnalysis(df)
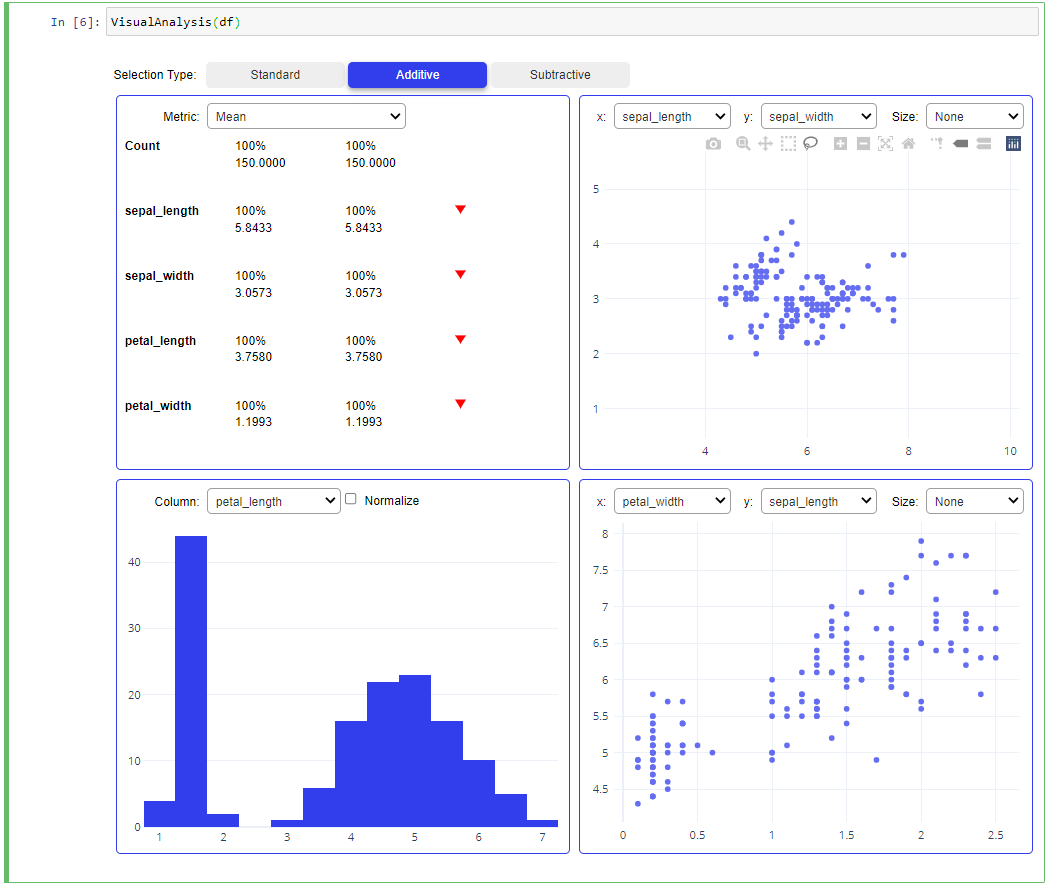
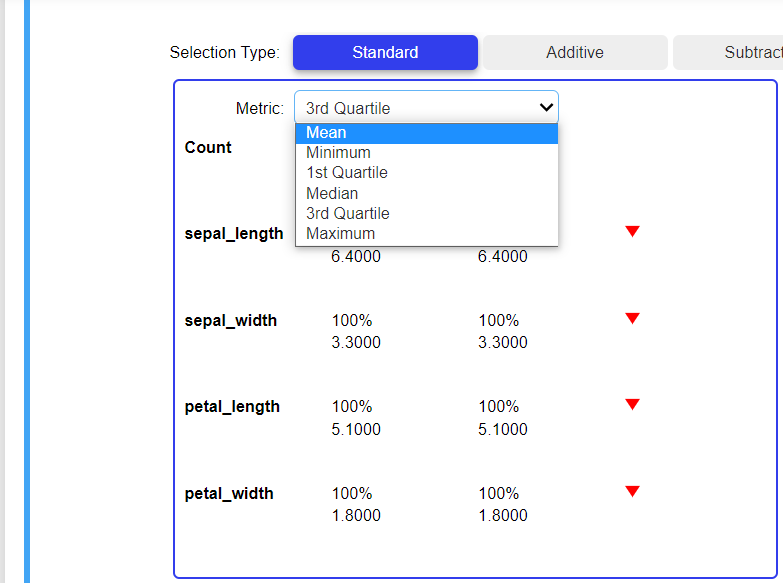
Here we have 3 selection types which are really amazing. The first is standard, here it is describing our dataset. If you write “df.describe()” at that time you will get all these things that are mention in the standard section type.
The next selection type is Additive, but for a better understanding of additive, we will cover what is Subtractive. Because once we understand Subtractive then it will be very easy to understand Additive.
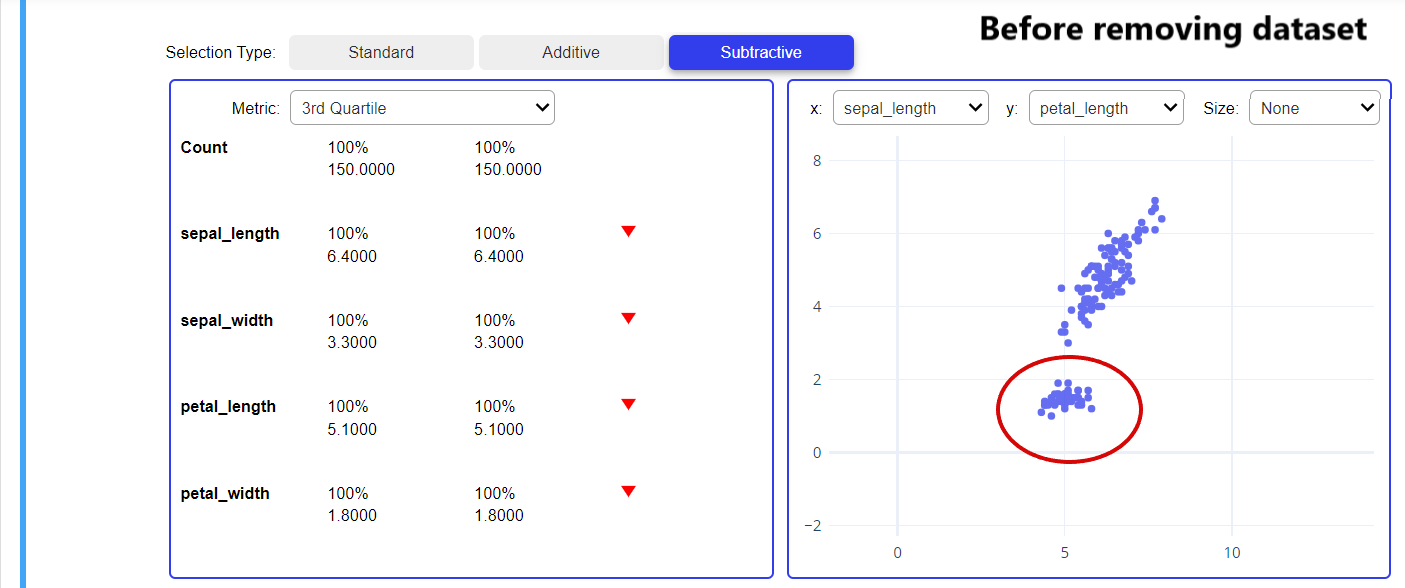
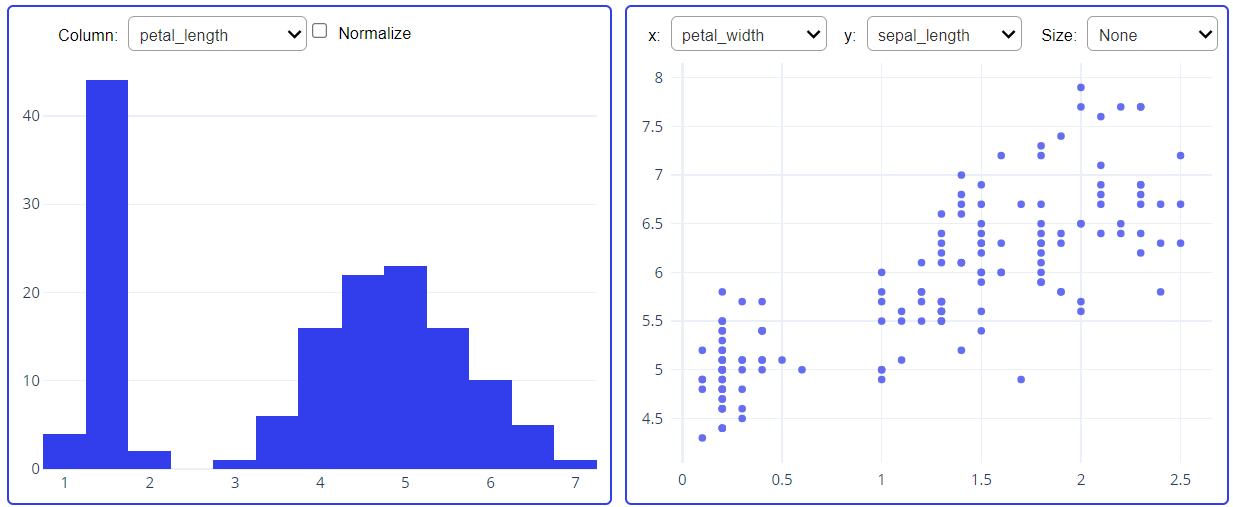
In subtractive we have an option to chose particular features and create a scatter plot among them. Subtractive provides one feature that from the scatter plot we can select some of the data points and remove them which will help us to analyze that what is the impact of that particular data points on our dataset. It will not permanently remove the data points, for only exploration purposes it will remove them.
In the below snapshot it is clearly mentioned that first, we remove the datapoints available in the red highlighted area, then check out the next snapshot where the removed data points are mentioned in grey color(grey color means data points are removed) and you can also see the change occur in the LHS part of both the images due to removing a small set of the data point.
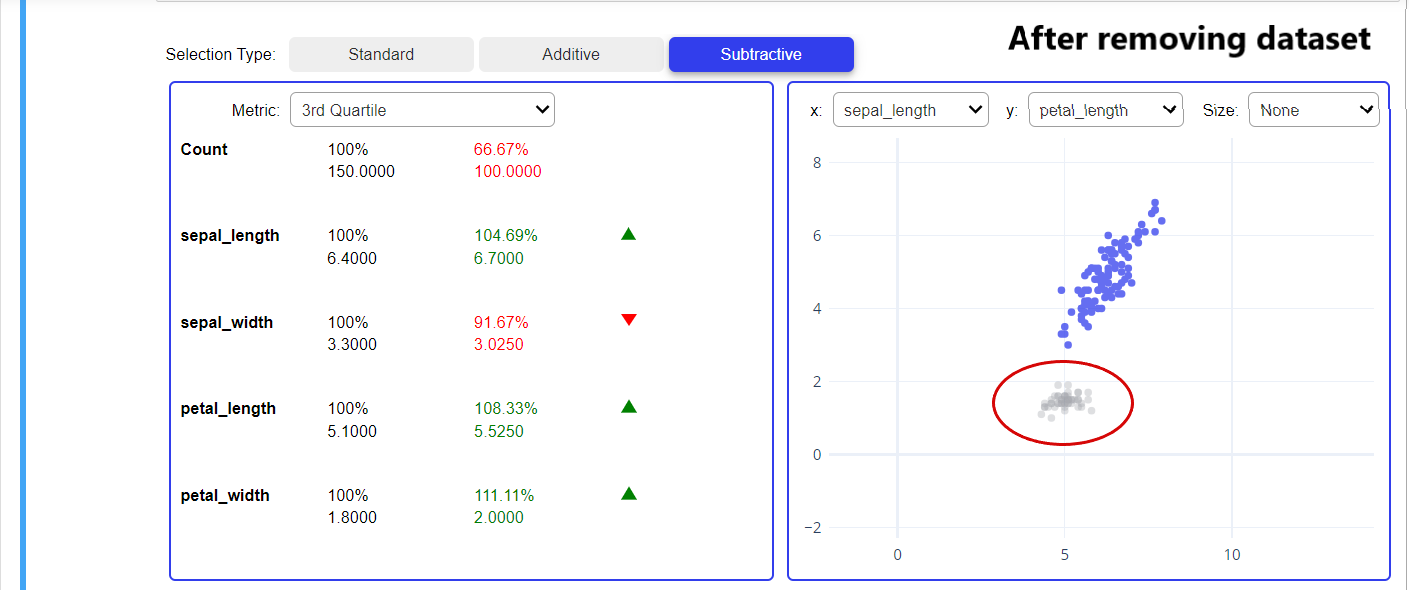
From the above snapshot, we can easily understand that what is the impact of the red highlighted part on our dataset after removing it. We have two more graphs in which first is describing that how much data is gone after removing the red highlighted area from that dataset.
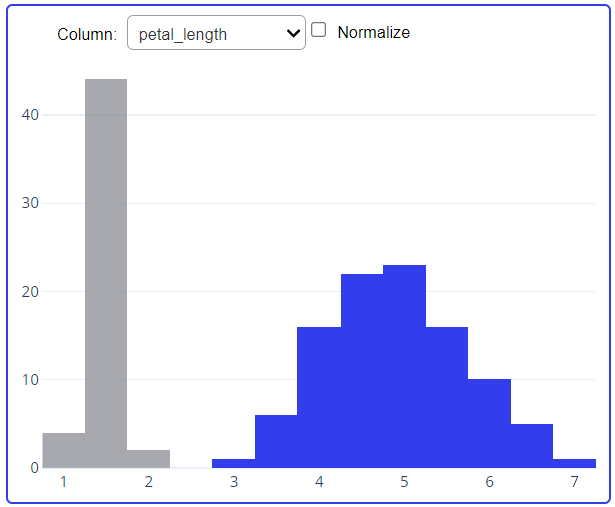
Here the greyish part is removed from the petal length after removing the red highlighted area from the above plot. Once we remove the elements if we have added that element again that time additive selection type will help us to add. Let’s add all the removed data and look at the changes in our plot.
It will help us to understand if we remove some certain data points which are far away from the mean of the data set then what will be the impact of removing that specific data points. It also provides the function of normalizing the features. You can check out the documentation, play with different parameters which will help you to dig deeper into this library.
I hope you enjoying reading my post! If you like the article, I would be glad. If you have any questions, feel free to leave me a message on Linkedin or a comment. See ya!
The media shown in this article are not owned by Analytics Vidhya and is used at the Author’s discretion.


