Big Data to Small Data – Welcome to the World of Reservoir Sampling
This article was published as a part of the Data Science Blogathon.
Introduction
Big Data refers to a combination of structured and unstructured data that may be measured in petabytes or exabytes. Usually, we make use of 3Vs to characterize big data 3Vs, being, the volume of data, the variety of types of data, and the velocity at which it is processed.
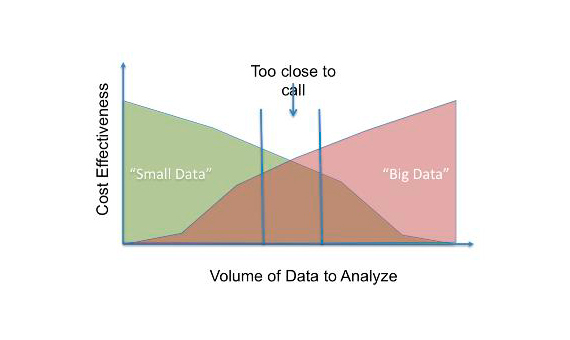
These three characteristics make it difficult to handle big data. Big data is hence expensive in terms of investment in a whole lot of server storage, sophisticated analytics machines, and data mining methodologies. Many organizations are finding this cumbersome both technically as well as economically and hence are thinking about how to achieve similar results can be achieved using much fewer sophistications. Hence they are trying to convert big data to small data, which consists of usable chunks of data. The following figure [1] shows a comparison.
Let’s try to explore a simple statistical technique, which can be used to create a usable chunk of data from big data. The sample which is basically a subset of the population should be selected in such a way that it represents the population properly. This can be ensured by employing statistical testing.
Introduction to Reservoir Sampling
The key idea behind reservoir sampling is to create a ‘reservoir’ from a big ocean of data. Let ‘N’ be the population size and ‘n’ be the sample size. Each element of the population has an equal probability of being present in the sample and that probability is (n/N). With this key idea, we have to create a subsample. It has to be noted, when we create a sample, the distributions should be identical not only row-wise but also column-wise.
Usually, we focus only on the rows, but it is important to maintain the distribution of the columns as well. Columns are the features from which the training algorithm learns. Hence, we have to perform statistical tests for each feature as well to ensure the distribution is identical.
The algorithm goes this way: Initialize the reservoir with first ‘n’ elements of the population of size ‘N’. Then read each row of your dataset (i > n). At each iteration, compute (n/i). We replace the elements of the reservoir from the next set of ‘n’ elements with a gradually decreasing probability.
for i = 1 to n:
R[i] = S[i]
for i = n+1 to N:
j = U ~ [1, i]
if j <= n:
R[j] = S[i]
Statistical Tests
As I mentioned, earlier we have to ensure that all the columns(features) in the reservoir are distributed identically to the population. We shall use the Kolmogorov-Smirnov test for continuous features and Pearson’s chi-square test for categorical features.
Kolmogorov-Smirnov test is used to check whether the cumulative distribution functions (CDF) of the population and sample are the same. We compare the CDFs of population F_N (x) with that of the sample F_n(x).
𝐹𝑁𝑥
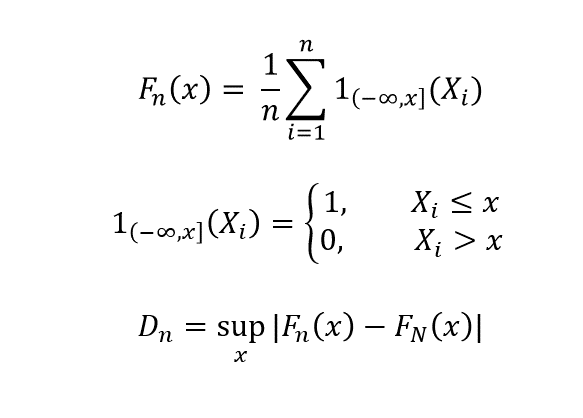
As n -> N, D_n -> 0, if the distributions are identical. This test has to be performed for all the features of the data set that are continuous.
For the categorical features, we can perform Pearson’s chi-square test. Let O_i be the number of observations of the category ‘i’ and ne be the number of samples. Let E_i be the expected count of category ‘i’. Then E_i = N p_i, where p_i is the probability from being of the category ‘i’. Then chi-square value is given by the following relation:
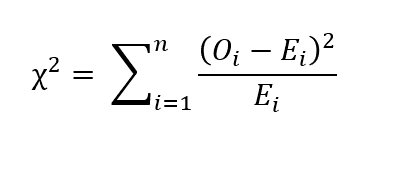
If chi-square = 0, then that means observed values and expected values are the same. If the p-value of the statistical test is greater than the significance level, then we say that the sample is statistically significant.
End Notes
Reservoir sampling can be used to create a useful chunk of data from big data provided that both the tests – Kolmogorov-Smirnov and Pearson’s chi-square is successful. The recent buzz is of course big data. Centralized models as in big data architecture come along with big difficulties. To decentralize things and thus making the work modular we have to create useful small chunks of data and then get meaningful insights from them. I think more efforts should come in this direction, rather than investing in architecture to support big data!
References
1. https://www.bbvaopenmind.com/en/technology/digital-world/small-data-vs-big-data-back-to-the-basics/


Statistic is a real life. Traditional and non-traditional methods. Please keep be updated with all statistics new subjects. My personal regards Dr/ Mona