


Today, more than 90% of AI practitioners experience significant cascading data errors, and poor data quality is estimated to cost companies 20% of revenue. The bottom line: bad data is ubiquitous and costly, and it also reduces organizations’ overall AI productivity. So what can today’s data leaders do to alleviate the bottleneck?

Too often, the interface between data owners and users is complex and implicit, such as 1,000 Parquet files in an S3 folder or a relational database with 500 tables and views. However, AI initiatives are dependent on much more than just the location and layout of data. Today’s AI users (who come from a range of backgrounds with vastly disparate skill sets and use cases for data) need to know properties such as:
- How often is the data updated?
- When was the last update?
- Does it include all observations or is it a sample?
- If it’s a sample, then how were observations selected?
- Are there duplicate observations?
- How is it skewed?
- Which fields have high null-value rates?
- What is the cardinality and distribution of key categorical variables?
- What are the service-level agreements from the owner?
- How often have the agreements been broken?
Productivity and quality improve if owners, not users, take responsibility for these questions. Data definition languages, wikis, and metadata repositories (such as Alation and Collibra) help, but we can do better. Increased collaboration between data owners and users can help facilitate even better solutions, including automatically updated dashboards and more.
Here is a concrete user story involving retail store sales data in two tables with these fields:
|
Sales Datetime Store ID Customer ID Product ID Price Quantity
|
Stores Store ID Country code Address 1 Address 2 State or Province Postal code Latitude Longitude
|
In this case, Sarah (a data engineer in the IT department proficient in Python and SQL) is the owner of this sales and store data, and different people want to use her data for use cases as vast as customer churn analysis, cross-selling, sales forecasts, and customer win-back campaigns.
This story shows how data quality can be a bottleneck for different users along the way and how increased collaboration and transparency facilitate reuse across people and teams that accelerate projects.
Mike, Business Analyst in Marketing
Skills: Excel Power User
Project/Use Case: Investigating churn of customers who have been buying for 5+ years
Mike has lots of questions about the sales table, including:
- What’s the date range?
- Does it cover all stores or just the United States?
- Are prices in U.S. dollars or local currency?
- Does the table include returned items?
He can’t find answers, so he asks a subcontractor in his department to generate some descriptive statistics about the table for him. That takes two weeks and isn’t as useful as he expected, so he asks the subcontractor for a random sample of 250,000 rows with a country code column appended. He estimates that 250,000 is the most that will fit in Excel on his laptop.
Receiving the data takes another two weeks. When he gets it, he quickly realizes that only 2% of the rows are from the United Kingdom, but he knows that far more than 2% of his company’s revenue comes from there. Further investigation convinces him that the data the subcontractor provided cannot possibly be a random sample.
He reissues the request, emphasizes the need for a random sample, and loses two more weeks. Now, Mike is six weeks into the project with nothing to show for it, so he gives up. He documents his project requirements and goals, sends them off to the company’s data science subcontractor in Poland, and hopes to get something back in a couple of months. Meanwhile, previously loyal customers continue to churn.

Jessica, Marketing Analyst
Skills: Tableau, SQL
Project/Use Case: Cross selling
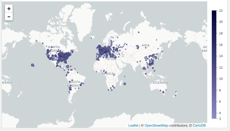 Jessica also wonders what countries are covered in the sales table but has Tableau skills, so she quickly creates an interactive dashboard with geographic visualizations of the past week, month and quarter of sales. The dashboard is available to everyone on her team.
She also sends a note to Sarah (the data owner) recommending that the dashboard be attached to the table rather than to Jessica’s team and that it be updated daily. Sarah agrees, so now the dashboard is available to everyone with access to the sales table.

Matt, Data Scientist in the Center of Excellence
Skills: Python, Scala
Project/Use Case: Machine learning operations
Matt sees that sales data is used in many production models, so he queries the company’s incident ticketing system to see how reliable it has been. There were many serious issues the past year, so he develops automated alerts to detect problems before they affect downstream users. Matt believes that data should have unit and subsystem tests just like code. After reviewing the root causes of past incidents, he develops alerts to trigger when there is more than a two standard deviation change in:
- Percentage of null values in a column
- Number of rows, quantity sold and total sales per country
- Number of countries
- Number of states or provinces per country, or
- Correlation between California and New York sales
Matt creates a statistical workbook that he can quickly check whenever an alert is issued and runs the tests for a couple of months, revising the workbook to get the false positive rate down to an acceptable level. He then shares his work with Sarah. Sarah really likes the null value and row count alerts and adds them to her data pipeline to benefit all users.

Emily, Data Engineer in Finance
Skills: Python, R, SQL
Project/Use Case: Sales forecasting
Emily works for the CFO and has one job: generate clean data for sales forecast modeling.
Her first question is whether the data includes Japan since Japanese stores are in a separate corporation. Emily sees that Sarah — via Jessica, our marketing analyst — provides a geographic visualization that is up-to-date. Thanks to this work, in just a few minutes, Emily is able to learn that Japan is indeed included.
Her second concern is gift cards and returned items, which are excluded from CFO forecasts. Emily reads Sarah’s wiki for the sales table and, again in minutes, sees that the table does include returns.
She creates a branch off of the sales pipeline, drops gift cards, returned items, and Japanese stores, and aggregates it by day and store to reduce the number of rows her modeling teams will work with. Emily’s team still gets the benefit of Matt’s work, since Sarah added some of Matt’s checks upstream of Emily’s pipeline. Ultimately, Emily has reused work from both Matt and Jessica, saving her precious time.
Jacob, Data Scientist in Marketing
Skills: Python, SQL
Project/Use Case: Win-back campaign for churned customers who had been buying for 5+ years
Next up is Jacob, working on a win-back campaign for long-term customers who churn. The campaign is highly experimental, so he’s only testing it in South America for now. He easily finds Jessica’s geographic visualization to verify that South America is included in the data, and Matt’s row count checks by country to see that there are enough rows to model South American customers. At the end of the day, Jacob too has been able to reuse the work of other data users and saved a lot of time.
The Bottom Line
The takeaway from this story? Common sense and economics tell us not to start from scratch every time, and that is exactly the principle behind addressing data quality in today’s world where the number of data users is growing exponentially.
Reuse is the simple concept of avoiding rework in AI projects, from small details (like code snippets that can be shared to speed up data preparation) to the macro level (including data quality efforts). AI platforms help alleviate some of the challenges by recognizing owners, treating users as co-developers, and facilitating the automatic update of dashboards, statistical workbooks, alerts for datasets, etc. Hint: Dataiku does all of this and more. Sound good? Take a deeper dive into what Dataiku has to offer.