Understanding The Concept Of Hypothesis In Data Science!
This article was published as a part of the Data Science Blogathon
Greetings, I am Mustafa Sidhpuri a Computer Science and Engineering student. Recently, I was learning about Hypothesis Testing. At first, I felt it was a little tough for me to understand, after reading a lot of blogs and watching videos about a hypothesis I was able to understand it. I would like to share a summary of what I learned with you all.
In this blog, I will try to explain what is Hypothesis and its types.
What is Hypothesis?
Suppose we have a huge amount of data. We take out a sample from the dataset and make some claims. Note that claims are not always valid, these are just assumptions or guesses, this type of claim or assumption is called Hypothesis.
Example 1:
Let us take an example to understand it more clearly. According to laws food manufacturing companies should not put more than 2.5 ppm(particle per million) Lead in food. So, let us take a company XYZ and we claim that the average amount of lead in food that XYZ company manufactures contains is more than 2.5 ppm.
This is just a claim based on the limited amount of data and not valid for the whole population. Hypothesis testing helps us verifying a claim on statistic values.
Example 2:
Let us take another example, suppose a person is charged for some trial where the jury has to decide whether the person is innocent or guilty.
It can be converted to 2 hypotheses:
Hypothesis 1: Defendant is innocent.
Hypothesis2: Defendant is guilty.
These two opposing hypotheses are called the null hypothesis and alternative hypothesis.
Null Hypothesis
The null hypothesis is a prevailing belief about the population. It states that there is no change or no difference in the situation.
It assumes the status quo (the existing state of affairs) is true.
In our example 2 defendant is a member of society, that is why he is considered innocent until proven guilty. So our null hypothesis claims the defendant is innocent just like he was before the charge.
The Null hypothesis is represented as H0.
Remember that the null hypothesis will always have these signs:
= ≤ ≥
Alternative Hypothesis
In simple words, we can define the alternative hypothesis as the opposite of the null hypothesis
Continuing the same example 2, our alternative hypothesis is that he is guilty.
The Alternative hypothesis is represented as H1
Remember that the Alternative hypothesis will always have these signs:
!= > <
Important points to remember:
- H0 and H1 cannot be true at the same time.
- We only reject or not reject the null hypothesis, we never accept it. If H1 is rejected it does not mean that H0 has to be accepted there might be some other possibilities.
Let us take some examples so that you can easily understand null and alternate hypotheses.
Situation 1: Flipkart claimed that its total valuation in December 2016 was at least $14 billion. Here the claim contains a ≥ sign, so the null hypothesis is an original claim.
The hypothesis, in this case, can be formulated as:
Total valuation ≥ $14 billion → Null Hypothesis
Total valuation < $14 billion → Alternate Hypothesis
Situation 2: Flipkart claimed that its total valuation in December 2016 was greater than $14 billion. Here the claim contains > sign, so the null hypothesis is the complement of the original claim.
The hypothesis, in this case, can be formulated as:
Total valuation ≤ $14 billion → Null Hypothesis
Total valuation >$14 billion → Alternate Hypothesis
Making a decision
We have understood the hypothesis, what is hypothesis testing, and how it is used in our daily lives. After knowing our alternate and null hypothesis, we have to reject or not the alternate hypothesis.
Suppose your friend brags that his archery score is 70. You don’t believe him and you tell him to play 5 games of archery with him and see what his score is. Unfortunately, his average score is 20. So yow will not believe him. If his score were 65 then you would believe him.
Here your H0: mean = 70 and H1: mean not equal to 70
5 games that you played were a sample and an average score of 70 which he told you was based on all of his games. Here we require a critical value that tells us that we can reject the H0 or we cannot reject the H0 (we never accept H0).

image source: Hands-On Machine Learning with Scikit–Learn and TensorFlow 2e
The shaded part on the left side of the graph is LCV(Lower Critical Values) and on the right side is called HCV(Higher Critical Values).
In the above figure, we see that a critical region appears on both sides, but this is not the case every time. It depends on the behavior of the alternate hypothesis.
There are generally two types of alternative hypothesis:
- Non-directional
- Directional.
Non-Directional alternate hypothesis
Taking the same example which we discussed above, our hypothesis is mean=70 or mean not equal to 70, so we do not know specifically that it is more than 70 or less than 70.
But, the mean can be less than or greater than 70 so here no direction is mentioned. This type is called a non-directional alternate hypothesis. It is also called the Two-Tailed Test.
The non-directional alternate hypothesis is generally used in the consistency of products, especially in pharmaceuticals.
Directional Alternate Hypothesis
Taking the same example of archery, now your friend says that he scores ≥70. So our hypothesis will be:
H0: mean ≥70
H1: mean <70
As we can see in H1, it clearly shows that our critical region will lie on the left side, it is in a specific direction. If our critical region lies on the left side then it is called a Left-tailed test
Similarly, if we have h1: mean>70, our critical region will lie on the right side. If our critical region is on the right side it is called a Right-tail test
Points to remember:
- != in H1 → Two-tail test
- < in H1 → Left-tail test
- > in H1 → Right-tail test
Below figure clearly explain directional and non-directional alternate hypothesis.
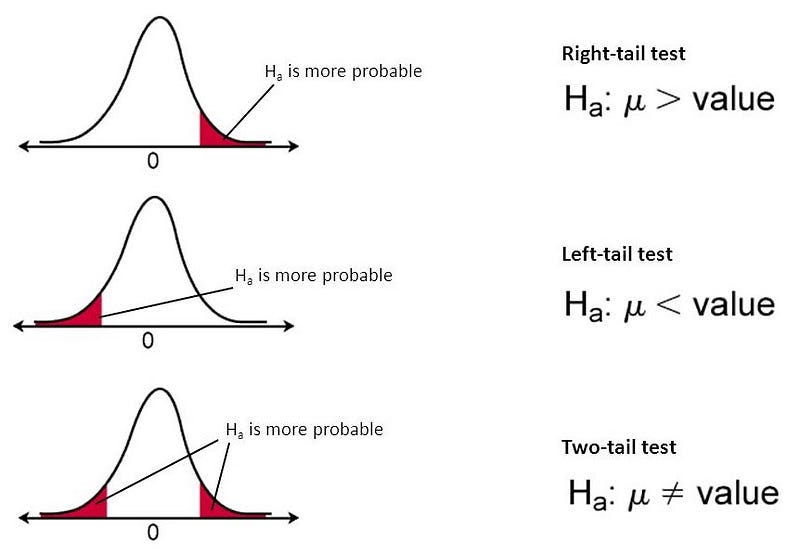
image source: https://towardsdatascience.com/everything-you-need-to-know-about-hypothesis-testing-part-i-4de9abebbc8a
How to calculate critical value?
We now know about the critical region, we need to know how to calculate it. There are several methods used to find critical regions or critical values. Two of them are mentioned below which you can explore:
- Critical Value Method.
- P-Value Method.
Note that there are other methods also available.
About me
I am Mustafa Sidhpuri a motivated Data Scientist with experience as a freelance data scientist. Passionate about building models that fix problems. Relevant skills include machine learning, problem-solving, programming, and creative thinking.
Contact: [email protected]
The media shown in this article are not owned by Analytics Vidhya and are used at the Author’s discretion.


