Data Preprocessing Using PySpark – Handling Missing Values
This article was published as a part of the Data Science Blogathon.
Introduction
In this article, we will be looking at how to handle the missing values using PySpark, as we all know that handling the missing value is one of the most critical parts of any data exploration and analysis pipeline and when we have a large dataset so data engineers should have enough skills to handle the NA/missing values in the dataset.
This is the second article in the PySpark series if you don’t understand the basics of a DataFrame in Pyspark then I’ll suggest you go through my previous articles:

Starting the PySpark Session
Here we are starting the SparkSession using the pyspark.sql package so that we could access the Spark object
from pyspark.sql import SparkSession

null_spark = SparkSession.builder.appName('Handling Missing values using PySpark').getOrCreate()
null_spark
Output:

Note: This segment I have already covered in detail in my first blog of the PySpark Series – Getting started with PySpark so please visit this article before moving forward with this one.
Reading the Dataset
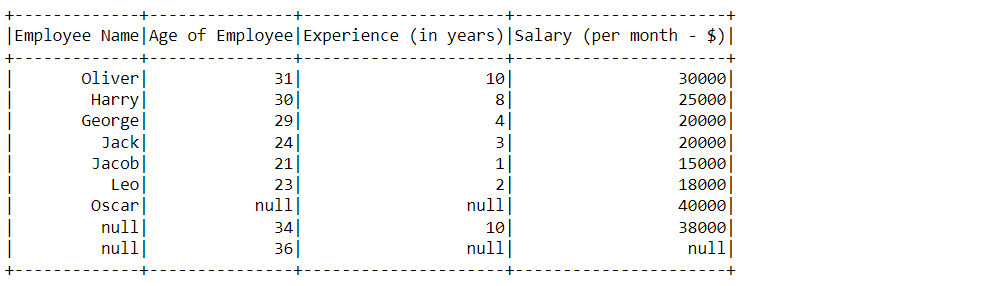
For this particular article, I have used one dummy dataset so that one can understand the operations easily from the ground level, and here we are reading the same.
df_null_pyspark = null_spark.read.csv('/content/part2.csv', header = True, inferSchema = True)
df_null_pyspark
Output:
DataFrame[Employee Name: string, Age of Employee: int, Experience (in years): int, Salary (per month - $): int]
Breaking down the read.csv() function: This function is solely responsible for reading the CSV formatted data in PySpark.
- 1st parameter: Complete path of the dataset.
- 2nd parameter: Header- This will be responsible for making the column name the column header when the flag is True.
- 3rd parameter: infer schema- This will make us show the original data type of each column when the flag is True.
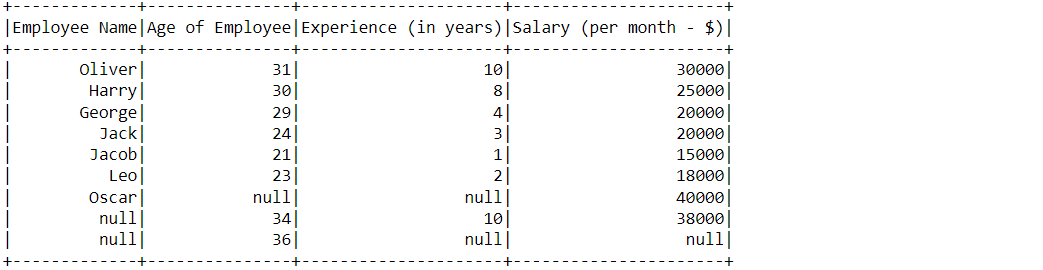
Displaying the Dataset using the Show() Function
We use the show() function to see the head (starting 20 rows – if there) in the dataset this function is very much similar to the head() function in pandas.
df_null_pyspark.show()
Output:
As mentioned in the Table of content so we will be working with the Dummy dataset to deal with the missing values in this article.
Dropping the NULL Values
df_null_pyspark.printSchema()
Output:

Inference: Here one can see that just after the name of the column of our dataset we can see nullable = True which means there are some null values in that column.
For dropping the Null (NA) values from the dataset, we simply use the NA. drop() function and it will drop all the rows which have even one null value.
df_null_pyspark.na.drop().show()
Output:

Inference: In the above output, we can see that rows that contain the NULL values are dropped.
So can we control it to some extent that based on some condition only, it will remove the null values?
The answer is YES! we can so let’s discuss how we can do that.
“HOW” Parameter in na.drop() Function
So this parameter is one way where we can decide in which condition we can skip the NULL values or remove them and while using this parameter we have two options with us let’s keep a note of it:
- HOW = “ANY”: The kind of keywords given to these functionalities is a straightforward explanation, yet when we select ANY, that signifies if at least one non-null value is there, then the no row will be dropped.
- HOW = “ALL”: When we will select the ALL option that signifies if the row has all the null values in its record, then only it will drop that row; otherwise there would be no effect (column will not drop).
HOW = “ANY”
df_null_pyspark.na.drop(how="any").show()
Output:

Inference: As discussed in the “any” option, it will drop the complete row when there is more than one NULL value otherwise row will remain unaffected.
HOW = “ALL”
df_null_pyspark.na.drop(how="all").show()
Output:
Inference: As discussed in the “all” option that it will drop the NULL values only if all the values in one tuple of the record are NULL otherwise there will be no change i.e. no row will be dropped and based on that only we can see there is no change in our dataset.
“THRESH” Parameter in na.drop() Function
In this parameter, we set the threshold value of the minimum NON NULL values in a particular row i.e. Suppose if we set the threshold value to 2, then that means the row will be dropped only if the total number of null values exceeds 2 otherwise, that row will not get dropped.
df_null_pyspark.na.drop(thresh=2).show()
Output:

Inference: Here in this output we can see that our last row has been dropped because it has a total of 3 null values which exceeded our threshold value and for other rows which have null values either equal to or less than 2 so it won’t get dropped.
“SUBSET” Parameter in na.drop() Function
This parameter will remind us of the pandas as the functionality of this parameter is the same as we used to pluck out specific columns from the dataset so here also we will get to know how we can draw a subset of specific columns from a complete dataset.
df_null_pyspark.na.drop(how='any', subset=['Experience (in years)']).show()
Output:

Inference: In the above output we can compare that the null value which was there in the “Experience (in years)” columns is successfully removed and other than that column no other null value has been dropped as we used the subset parameter.
Similarly, if we want the same thing with multiple columns we can simply add more of the columns separated by commas and inside the inverted commas, and then we are good to go with multiple columns as well.
Filling Missing Values
This parameter will be responsible to fill the missing (NULL) values in the dataset which are present in NA.fill() function.
- The first parameter of this function will be the value that needs to be imputed in place of the missing/ null value.
- The second parameter is where we will mention the name of the column/columns on which we want to perform this imputation, this is completely optional as if we don’t consider it then the imputation will be performed on the whole dataset.
Let’s see the live example of the same.
df_null_pyspark.na.fill('NA values', 'Employee Name').show()
Output:
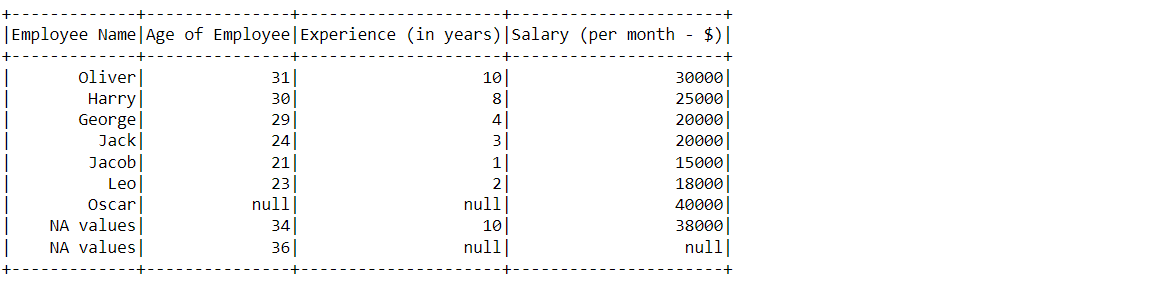
Inference: In the above output one can see that I have utilized both the options i.e. imputing values as well as on a specific column and got the expected results as well.
Note: If we want to perform the above operation of multiple columns then we just need to pass the name of those columns in the list data type.
Imputing NA values with central tendency measured
This is something of a more professional way to handle the missing values i.e imputing the null values with mean/median/mode depending on the domain of the dataset. Here we will be using the Imputer function from the PySpark library to use the mean/median/mode functionality.
from pyspark.ml.feature import Imputer

imputer = Imputer(
    inputCols = ['Age of Employee', 'Experience (in years)', 'Salary (per month - $)'],
    outputCols = ["{}_imputed".format(a) for a in ['Age of Employee', 'Experience (in years)', 'Salary (per month - $)']]
).setStrategy("mean")
Code breakdown: There are a lot of things going on here so let’s break it down.
- First, we have called the Imputer function from PySpark’s ml. feature library.
- Then using that Imputer object we have defined our input columns, as well as output columns in input columns we gave the name of the column which needs to be imputed, and the output column is the imputed one.
- Then at the last, we set the strategy of imputing values (here it’s mean) but we can either use median or mode depending on the dataset.
Fit and Transform
Now so we have used the Imputer object to impute the mean values in the place of null values but to see the changes we need to use the fit-transform method simultaneously.
imputer.fit(df_null_pyspark).transform(df_null_pyspark).show()
Output:
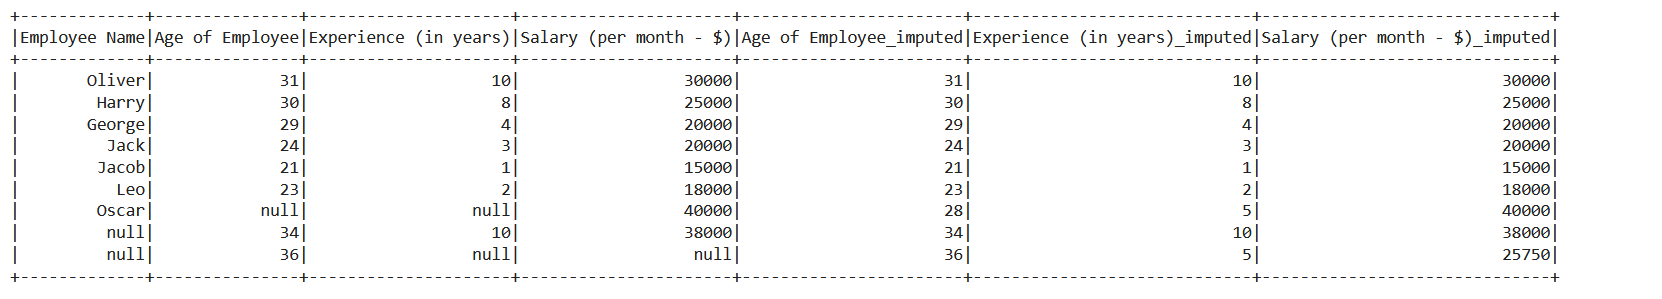
Inference: Here we can see that three more columns got added at the last with postfix as “imputed” and the Null values are also replaced in those columns with mean values for that we have to use the fit and transform function simultaneously which will deliberately add the imputed columns in our DataFrame.
Note: It’s always a good practice to drop the previous columns that are still holding the NULL values as it will hamper the data analysis and machine learning phase.
Conclusion
So in this article, we learned how to handle the missing values in the dataset and also get to know about the various methods of imputing the NA values whether using the NA.drop() method or other central tendency methods.
- First of all, we did the mandatory steps which are required whenever we have to work with PySpark i.e. to start the Pyspark session and read the dataset on which we will be performing the operations.
- Then we learned how and when to drop the complete columns from the dataset and which functions are required to do so.
- After knowing how to drop the columns we also came across how to drop the rows from the dataset depending on the business requirements.
- Then we deep-dived into the different parameters of the dropping functions which let us know what each parameter was contributing to the function.
- At the last, we learned how to impute the values using either mean, mode, or median which is one of the standard ways to deal with missing values.
Here’s the repo link to this article. I hope you liked my article on Data Preprocessing using PySpark – PySpark’s DataFrame. If you have any opinions or questions, then comment below.
Connect with me on LinkedIn for further discussion.
The media shown in this article is not owned by Analytics Vidhya and is used at the Author’s discretion.


