Elevate Financial Intelligence with Data Visualization

When the prognosticators at Gartner start forecasting the future, people tend to pay attention. Those experts have released their latest set of predictions, this time focused on the top priorities for CFOs in 2020. Here’s what they identify:
- Improving Financial Analytics – Despite a 50 percent increase in spending on financial analytics over the last three years, few companies have advanced analytics capabilities. That needs to change as analytics becomes one of the finance department’s core responsibilities.
- Restructuring Finance Teams – As finance teams grow in importance, traditional methods for organizing and utilizing those teams become less useful. The department needs a shakeup from the top down to remain relevant.
- Optimizing Finance Technology – Finance teams need to extract more value from the ERP while embracing newer technologies and preparing to become more tech-driven. Failure to do so only makes the finance department less intelligent and agile.
Any of those initiatives could keep a CFO busy for an entire year without producing much progress. However, if those executives think about these issues holistically, understanding how the problems and priorities overlap with one another, a surprising solution reveals itself: data visualization. This one upgrade could help CFOs make significant progress toward their 2020 goals long before the year is up.
Data Visualizations: Past and Present
For as long as there has been data, there has likely been some form of data visualization. Think of an abacus, for example. Ancient peoples understood that dealing entirely in numbers becomes boring at best and confusing at worst, so they developed a brilliantly simple way to represent numbers and their relationship with one another using sliding wooden blocks.
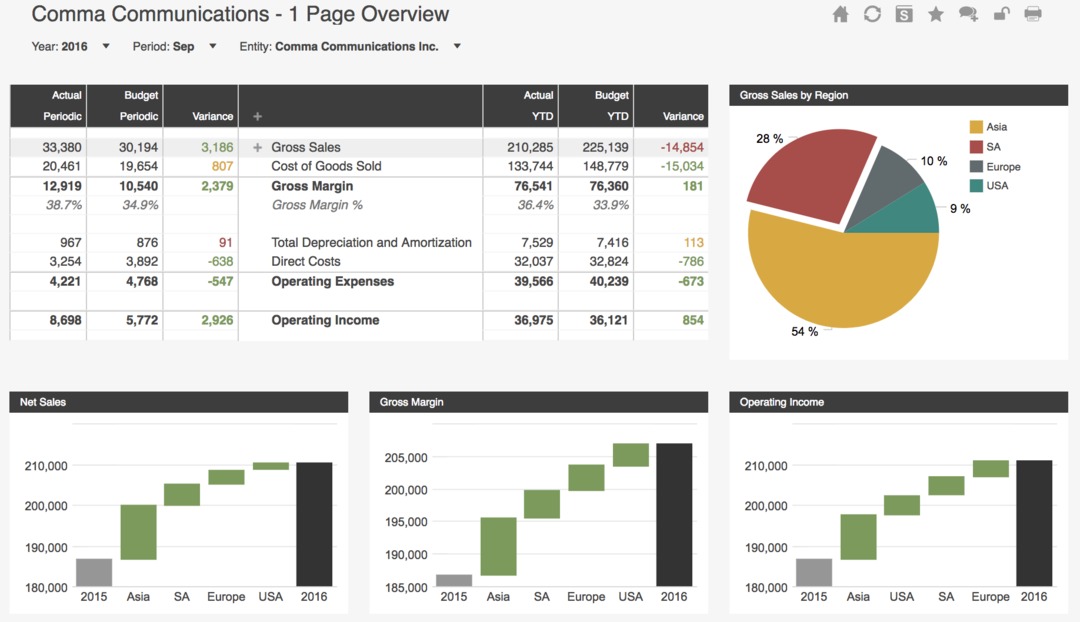
More recently, Excel spreadsheets made things like charts and graphs into everyday business tools. Users quickly learned that visual formats make complex data easier to understand. Rather than meticulously studying a spreadsheet, they could glance at something like a pie chart and immediately identify the key takeaways. Compared to what came before, digital visualizations gave the finance team an entirely new perspective into data and a game-changing tool for decision making.
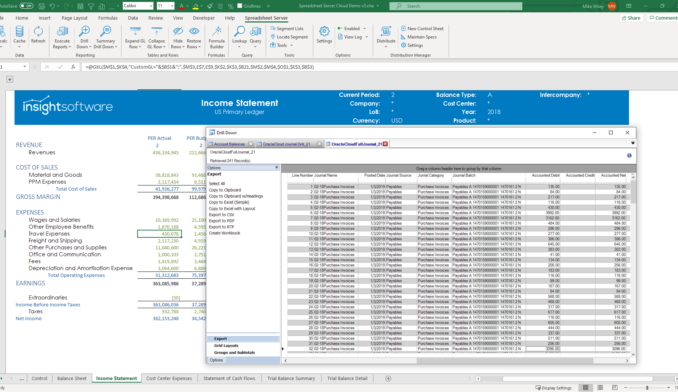
Now, visualizations have made another leap forward, and it’s arguably the largest one yet. Today’s top financial reporting solutions, ones that operate on top of the ERP and outside the limitations of Excel, come with advanced visualization capabilities included. More than just building on what came before, these visualization tools transform the relationship between the finance department and the data on which it depends more heavily than ever before.
Understanding Today’s Data Visualizations
So what’s different? First and foremost, visualizations have advanced beyond simple graphs and charts. They can now visualize data in new formats that offer rich levels of detail and context. With this expanded toolkit at their disposal, users can identify the perfect visualization to encapsulate the data instead of simply settling for an adequate option.
After making that decision, building the visualization itself becomes almost effortless. In many cases, it takes just a few clicks instead of requiring an in-depth process of manually moving data from one location to another. Not only does this save a lot of time and prevent a lot of errors, but it also allows anyone inside or outside the finance team to build their own visualization without needing specialized training.
Finally and arguably most importantly, visualizations now exist at the forefront of the decision-making process. The finance team can easily embed them into financial reports and format them to maximize the insights contained within along with the ease of extracting them out. The visual elements inside those reports aren’t static, either. They update themselves as new data becomes available so that they function less as visualizations and more like dynamic indicators that track key metrics in real-time.
Everything about today’s visualizations is fundamentally better than what came before. That being said, it’s still easy to underestimate how big an impact they have on the CFO, the finance team, and the enterprise as a whole. They’re certainly more pleasing to the eye and easier to use, but the benefits run far deeper.
Using Visualizations to Improve Financial IQ
Data visualizations don’t just help people see data differently, they help them see it better, highlighting insights, opportunities, and obstacles that would have been invisible otherwise.
One way data visualizations do that is by condensing massive amounts of information into an easily digestible format. Financial reports drive decision making, but in the past, these documents have either been too basic to reveal much of importance or too complex to spur on action. Today’s visualizations split the difference so that reports contain everything decision-makers need to know and make those insights apparent in an instant.
Modern data visualizations also do the opposite, enabling F&A to explore financial data on its own terms. Decision-makers know better than anyone what information they need, and once it becomes easy to seek it out and visualize it as necessary, comprehension gaps disappear. To put it differently, visualizations make an ocean of complex financial data accessible to the point that it’s explorable. Anyone inclined to dive into the data now has an ideal entry point.
In addition to helping CFOs learn more, visualizations help professionals outside finance to understand a subject that can be baffling to the uninitiated. Executives and department heads all need to understand how their own actions affect enterprise finances on a micro and macro level, yet many don’t have the expertise to make sense of a financial report presented as a dense spreadsheet. Presented using visualizations, however, the information comes to life in ways that anyone can understand. That way, financial intelligence improves across the enterprise.
See the Data Like Never Before
Finance teams can make progress on all of 2020’s top priorities by implementing advanced data visualizations. Once in place, analytics improve immeasurably, accountants waste less time manually manipulating data, and the ERP stops being an obstacle to understanding.
If that sounds like an overstatement, consider the visualization tools from insightsoftware. These tools go leaps and bounds beyond what you’re accustomed to from Excel in terms of accessibility, accuracy, and variety. Better still, they’re just one of many features included in purpose-built financial reporting tools engineered to integrate with today’s most popular ERPs. If you’re looking for a new approach to data, we offer an across-the-board upgrade. Make 2020 the year you start to see everything with dashboards that make financial intelligence an at-a-glance endeavor. Request a free demo to see how it all works today.

_1080x.jpg)


