

With the release of CDH6.3 customers can now use OpenJDK11 with Cloudera Enterprise 6.3 and HBase 2.1.
One of the changes in JDK11 is the Garbage Collector. A garbage collector (GC) is a memory management tool. JDK11 now uses Garbage First Garbage Collector as the default garbage collector and also introduced the new Z Garbage Collector (ZGC).
Here we talk about GC tuning configurations and how to proceed as you migrate your existing CDH HBase application to the JDK 11 release.
The G1GC Garbage Collector
The Garbage First Garbage Collector (G1 GC) is a low-pause, server-style generational garbage collector for Java HotSpot VM. The G1 GC uses concurrent and parallel phases to achieve its target pause time and to maintain good throughput. When G1 GC determines that a garbage collection is necessary, it collects the regions with the least live data first (garbage first). G1’s mechanisms to incrementally reclaim space in the heap and the pause-time control incur some overhead in both the application threads and in the space-reclamation efficiency.
G1 aims to provide the best balance between latency and throughput using current target applications and environments whose features include:
- Heap sizes up to ten of GBs or larger, with more than 50% of the Java heap occupied with live data.
- Rates of object allocation and promotion that can vary significantly over time.
- A significant amount of fragmentation in the heap.
- Predictable pause-time target goals that aren’t longer than a few hundred milliseconds, avoiding long garbage collection pauses.
G1 Garbage Collector Heap Layout
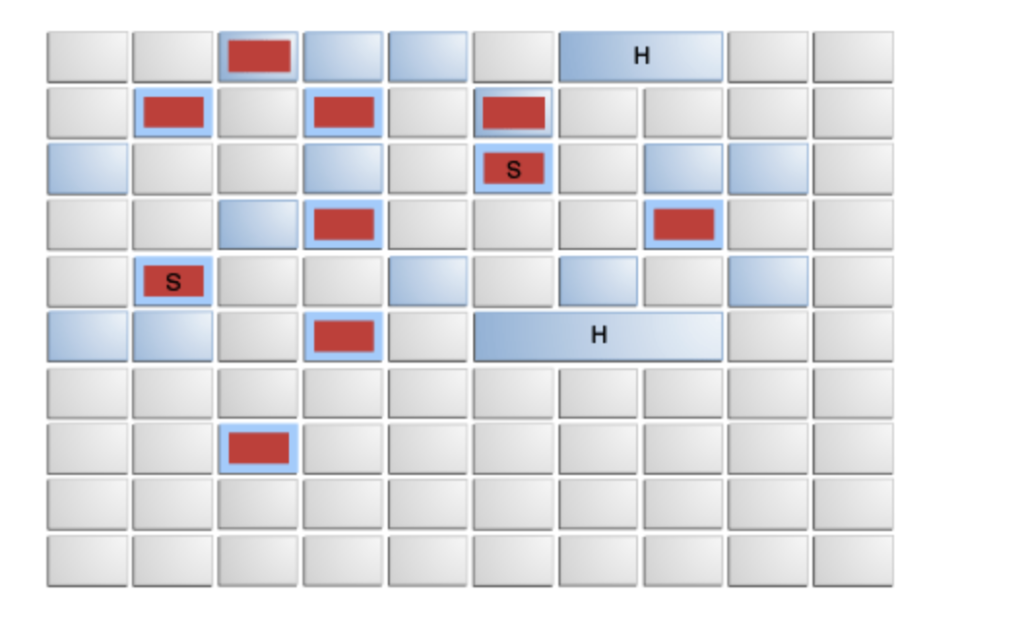
Arrangement of Generations and Heap Layout in the Parallel Collector and CMS
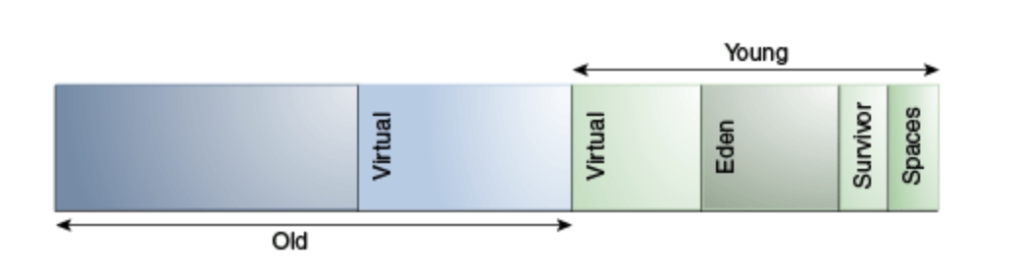
(Image refs: https://docs.oracle.com/en/java/javase/11/gctuning/)
G1 GC is the default GC with JDK11 and replaces the previous default GC Parallel collector.
CDH5.x, CDH6.1 and CDH6.2 HBase used JDK8 with CMS (ConcMarkSweepGC) garbage collector. CDH6.3 HBase runs with JDK11, here we tested CDH6.3 HBase with the default G1GC, CMS and the new ZGC.
Comparing CMS and G1GC:
- G1GC reduces heap fragmentation by incremental parallel copying of live objects from one or more sets of regions (called Collection Set (CSet)) into different new region(s) to achieve compaction. CMS does not defragment the old generation heap, and can eventually run into long Full GC’s.
- G1GC may exhibit higher overhead than other collectors, affecting throughput due to its concurrent nature.
The Z Garbage Collector
JDK11 has a new GC The Z Garbage Collector (ZGC). ZGC is a scalable low latency garbage collector. ZGC performs all expensive work concurrently, without stopping the execution of application threads for more than 10ms, which makes is suitable for applications which require low latency and/or use a very large heap (multi-terabytes).
The Z Garbage Collector is available as an experimental feature, and is enabled with the command-line options -XX:+UnlockExperimentalVMOptions -XX:+UseZGC.
We ran HBase YCSB tests with ZGC as well to compare with G1GC and CMS.
More info about G1GC and Z Garbage Collector at https://docs.oracle.com/en/java/javase/11/gctuning/introduction-garbage-collection-tuning.html
Test Results
G1GC and JDK11 Heap sizes
We ran CDH6.3 HBase YCSB workloads on JDK8 vs JDK11 for our testing. For large heaps like 32GB the throughput for JDK8 using CMS and JDK11 using G1 GC was the same.
For HBase we recommend G1GC for regionserver and master with 16GB heaps or more, if your heap is less than 16GB, you should enable ConcMarkSweep with JDK11 using java command line option -XX:+UseConcMarkSweepGC
Running HBase with smaller than 16GB heaps will result in out of memory issues (some of which can be remediated)
We tested different G1GC tuning options with HBase using YCSB test case. We reduced the HBase RegionServer heap size to 12GB to test the impact of the different G1GC tuning options with a stressed heap.
Running HBase YCSB workloads with 12GB heap, our tests completed successfully but showed “to-space exhausted” messages in GC logs
What is to-space exhausted error?
When you see to-space exhausted messages in GC logs, it means that G1 does not have enough memory for either survived or tenured objects, or for both, and the Java heap cannot be further expanded since it is already at its max. This event happens when G1 tries to copy live objects from the source space to the destination space. Note that, in G1, it avoids heap fragmentation by compaction (i.e., done when objects are copied from source region to destination region).
Example Message:
[2938.069s][info][gc,start      ] GC(541) Pause Young (Mixed) (G1 Evacuation Pause)
[2938.069s][info][gc,task       ] GC(541) Using 28 workers of 28 for evacuation
[2938.142s][info][gc            ] GC(541) To-space exhausted
[2938.142s][info][gc,phases     ] GC(541) Pre Evacuate Collection Set: 9.1ms
[2938.142s][info][gc,phases     ] GC(541) Evacuate Collection Set: 38.5ms
[2938.142s][info][gc,phases     ] GC(541) Post Evacuate Collection Set: 22.2ms
[2938.142s][info][gc,phases     ] GC(541) Other: 3.0ms
How to remove to-space exhausted errors?
When “to-space exhausted” event gets triggered, there is not enough room for shuffling live data objects in the Java heap, GC pause time will be longer since both CSet(Collection Set) and RSet(Remembered Set) need to be re-generated. The easiest approach to resolve this is increasing your heap size if it’s possible.
A series of “to-space exhausted” events eventually lead to a Full GC. Full GC is a compaction event where it can walk around “to-space exhausted” issue without needing extra space.
Our to-space exhausted was followed by Full GC as shown below:
[2938.142s][info][gc            ] GC(541) To-space exhausted
[2938.142s][info][gc,phases     ] GC(541) Pre Evacuate Collection Set: 9.1ms
[2938.142s][info][gc,phases     ] GC(541) Evacuate Collection Set: 38.5ms
[2938.142s][info][gc,phases     ] GC(541) Post Evacuate Collection Set: 22.2ms
[2938.142s][info][gc,phases     ] GC(541) Other: 3.0ms
[2938.142s][info][gc,heap       ] GC(541) Eden regions: 133->0(140)
[2938.142s][info][gc,heap       ] GC(541) Survivor regions: 20->13(20)
[2938.142s][info][gc,heap       ] GC(541) Old regions: 1702->1878
[2938.142s][info][gc,heap       ] GC(541) Humongous regions: 1181->1181
[2938.142s][info][gc,metaspace  ] GC(541) Metaspace: 75404K->75404K(1118208K)
[2938.142s][info][gc            ] GC(541) Pause Young (Mixed) (G1 Evacuation Pause) 12134M->12280M(12288M) 72.698ms
[2938.142s][info][gc,cpu        ] GC(541) User=1.21s Sys=0.35s Real=0.08s
[2938.142s][info][gc,task       ] GC(542) Using 28 workers of 28 for full compaction
[2938.143s][info][gc,start      ] GC(542) Pause Full (G1 Evacuation Pause)
[2938.147s][info][gc,phases,start] GC(542) Phase 1: Mark live objects
[2938.477s][info][gc,stringtable ] GC(542) Cleaned string and symbol table, strings: 24817 processed, 325 removed, symbols: 164378 processed, 0 removed
[2938.477s][info][gc,phases      ] GC(542) Phase 1: Mark live objects 329.505ms
[2938.477s][info][gc,phases,start] GC(542) Phase 2: Prepare for compaction
[2938.601s][info][gc,phases      ] GC(542) Phase 2: Prepare for compaction 124.266ms
[2938.601s][info][gc,phases,start] GC(542) Phase 3: Adjust pointers
[2938.772s][info][gc,phases      ] GC(542) Phase 3: Adjust pointers 170.673ms
[2938.772s][info][gc,phases,start] GC(542) Phase 4: Compact heap
[2939.418s][info][gc,phases      ] GC(542) Phase 4: Compact heap 646.229ms
[2939.435s][info][gc,heap        ] GC(542) Eden regions: 0->0(153)
[2939.435s][info][gc,heap        ] GC(542) Survivor regions: 13->0(20)
[2939.435s][info][gc,heap        ] GC(542) Old regions: 1878->1329
[2939.435s][info][gc,heap        ] GC(542) Humongous regions: 1181->1181
[2939.435s][info][gc,metaspace   ] GC(542) Metaspace: 75404K->75347K(1118208K)
[2939.435s][info][gc             ] GC(542) Pause Full (G1 Evacuation Pause) 12280M->9939M(12288M) 1292.525ms
We further stressed the JVM by reducing heap sizes to 1/4th of our original heap changing from 32GB -> 8GB and re-ran the YCSB tests with 8GB heap using G1GC.
YCSB test run results with 8GB region server heap:
With JDK8 CMS: The test ran fine but the throughput reduced
With JDK11 G1GC: The test failed with OOM errors
With JDK11 with CMS: The test ran fine with throughput similar to JDK8
To fix the JDK11 G1GC OOM we changed 2 HBase RegionServer configs for 8G JDK11 cluster and that helped JDK11 G1GC test run complete successfully without OOMs.
In HBase config properties for each HBase Region Server in our cluster we changed the below configs using Cloudera Manager:
HFile Block Cache Size (hfile.block.cache.size) changed from 0.4 -> 0.35
Maximum Size of All Memstores in RegionServer (hbase.regionserver.global.memstore.size, hbase.regionserver.global.memstore.upperLimit) changed from 0.4 -> 0.35
With these values set to 0.35 each we now had 5.6GB (8G * 0.7) heap for caching and memstore and 2.4GB remaining for other allocations. Previously with the values set to 0.4 we were using 80% (0.4 + 0.4 = 0.8) of the heap for memstore and caching in the RegionServer Heap, with the 8G heap this was almost 6.4G ( 8GB * 0.8) leaving only 1.6GB (8GB – 6.4GB) heap for other allocations.
In CDH5.x and CDH6.x HBase default for these configs HFile Block Cache Size and Maximum Size of All Memstores in RegionServer is 0.4. When using CDH6.3 HBase with a smaller RegionServer heap with G1GC changing these configs to a lower value will help.
Based on our test results, JDK11 G1GC uses more memory than CMS for the same application, G1GC is made for larger heaps. For over-committed application heaps you could switch to using CMS as the garbage collector in JDK11.
The CMS collector can be enabled with the command-line option -XX:+UseConcMarkSweepGC
G1GC and JDK 11 GC options
We further tested different G1GC tuning options and their impacts on YCSB workloads run performance with CDH 6.3 HBase
-XX:+UseStringDeduplication
-XX:G1ReservePercent
-XX:G1HeapRegionSize
-XX:ConcGCThreads=n
-XX:InitiatingHeapOccupancyPercent
Test Results with the G1GC tuning options
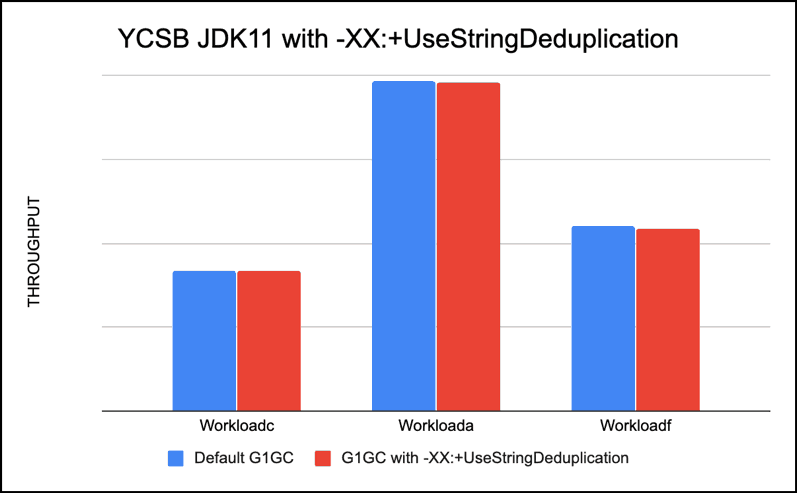
-XX:+UseStringDeduplication
Enables string deduplication. By default, this option is disabled. To use this option, you must enable the garbage-first (G1) garbage, collector.
String deduplication reduces the memory footprint of String objects on the Java heap by taking advantage of the fact that many String objects are identical. Instead of each String object pointing to its own character array, identical String objects can point to and share the same character array.
Recommendation: We did not expect a lot of strings to be repeated in our YCSB test case but tested to see how using it affects our test run, we did not see a significant difference, in fact, our throughput was very close and very slightly lower with this option.
We recommend only using it if you expect repeated strings in your application. If you are using custom coprocessors in HBase that use a lot of Strings, this setting should reduce the overall heap usage with string de-duplication.
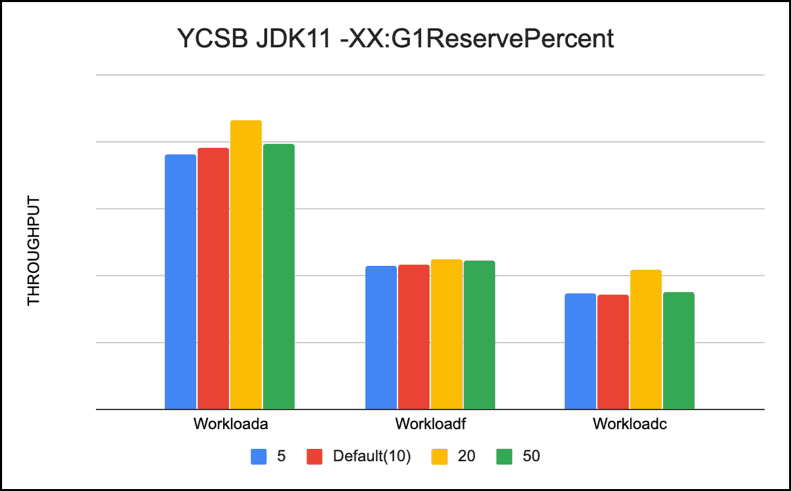
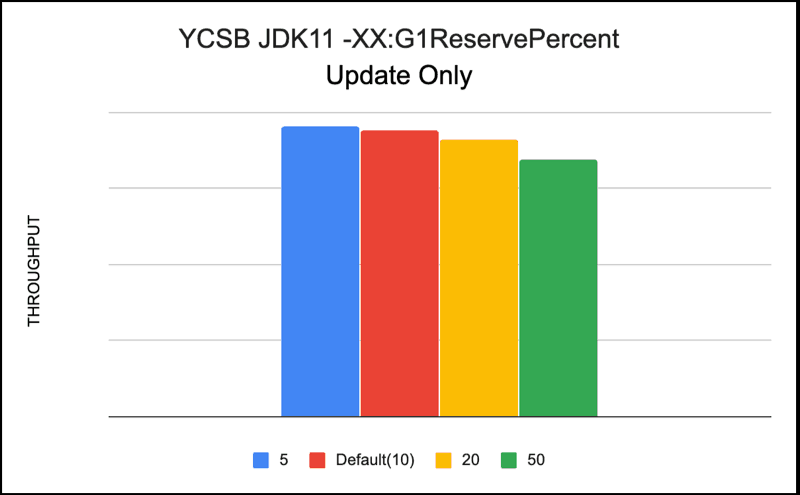
-XX:G1ReservePercent (Default 10)
This option sets the percentage of reserve memory to keep free so as to reduce the risk of to-space overflows. The default is 10 percent. When you increase or decrease the percentage, make sure to adjust the total Java heap by the same amount.
We tested different values of this parameter 5, 20, 50 and default(10) without changing the heap sizes. In our tests we were running into to-space exhaustion, so we decided to adjust it and measure its impact. For our YCSB workloads -XX:G1ReservePercent=20 gave us the best performance.
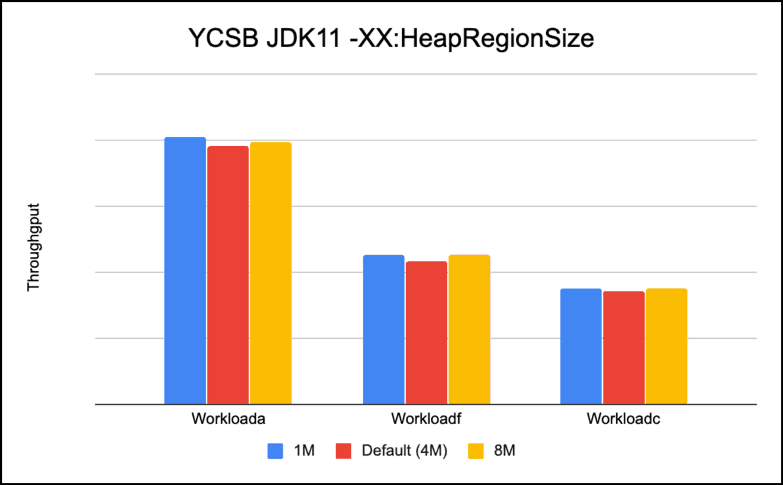
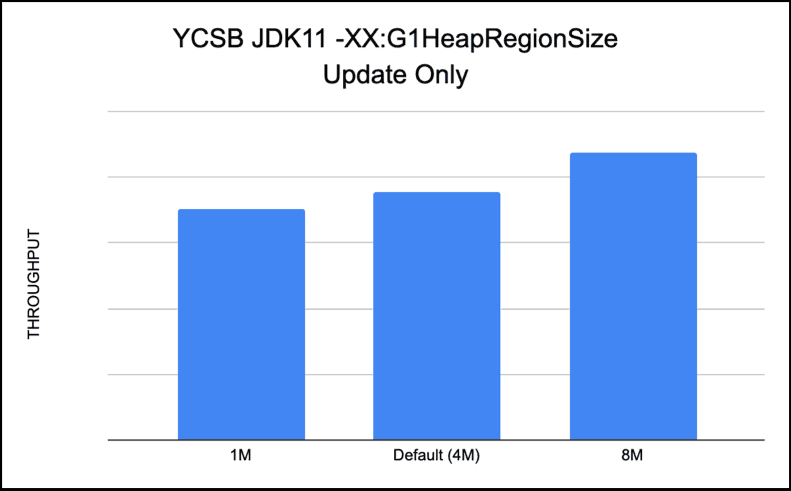
-XX:G1HeapRegionSize (Default 4MB in our case with 12GB Heap)
This option sets the size of a G1 region. The value will be a power of two and can range from 1MB to 32MB. The goal is to have around 2048 regions based on the minimum Java heap size.
We tested with -XX:G1HeapRegionSize = 1M, 8M and default(4M). Our results show that bigger size regions are better. For our workloads which did reads like workloada, workloadc, workloadf the difference was not much, but our update only workload performed 15% better with larger region sizes.
We feel UpdateOnly workload is only doing writes, and with smaller region size has lot more regions to go over during GC, so shows better throughput with larger and fewer regionsizes.
Recommendation: Bigger region sizes are better for performance for bulk updates and read workloads
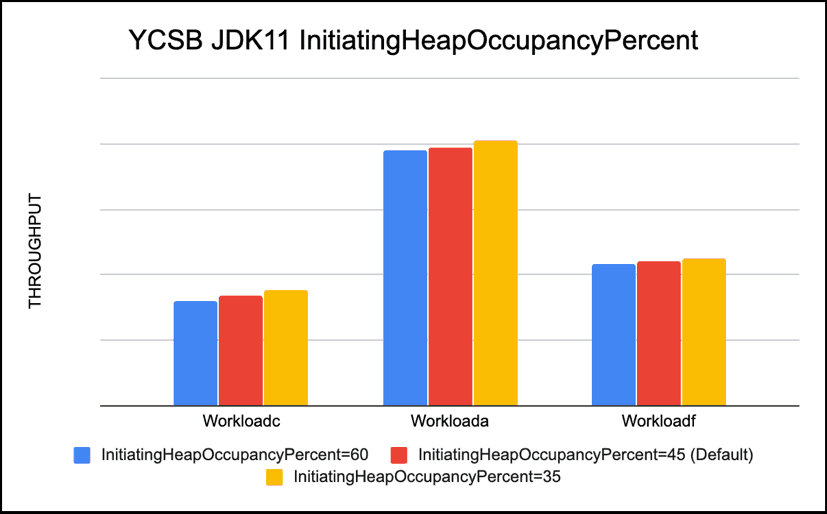
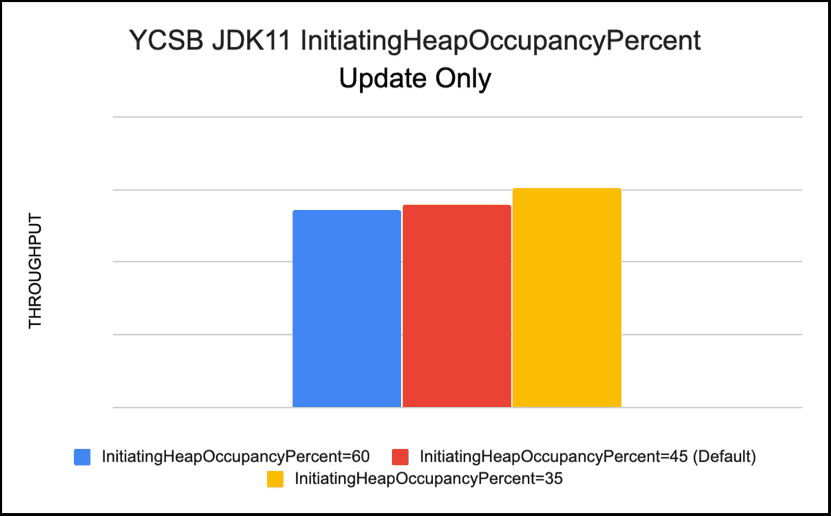
-XX:InitiatingHeapOccupancyPercent
This -XX:InitiatingHeapOccupancyPercent parameter sets the Java heap occupancy threshold that triggers a marking cycle. The default occupancy is 45 percent of the entire Java heap. We changed it from 45 (default) to 35 to initiate the heap sooner since our heap was stressed and showed to-space exhausted messages. Reducing -XX:InitiatingHeapOccupancyPercent seemed to help our Read workloads
Recommendation: Lower threshold of -XX:InitiatingHeapOccupancyPercent gives better throughput in a heap constrained environment

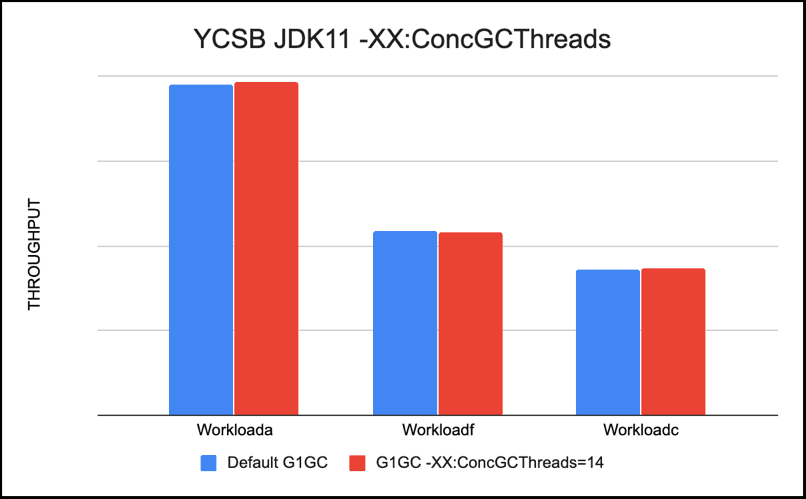
-XX:ConcGCThreads=n
This G1GC option sets the number of parallel marking threads. By defaults n is set to approximately 1/4 of the number of parallel garbage collection threads (ParallelGCThreads). In our case Parallel GC threads were 28 and with -XX:ConcGCThreads set to 7 default in our case. We tested with XX:ConcGCThreads=7 and 14. Performance was better with more -XX:ConcGCThreads.
Recommendation: Higher count of -XX:ConcGCThreads gives better performance
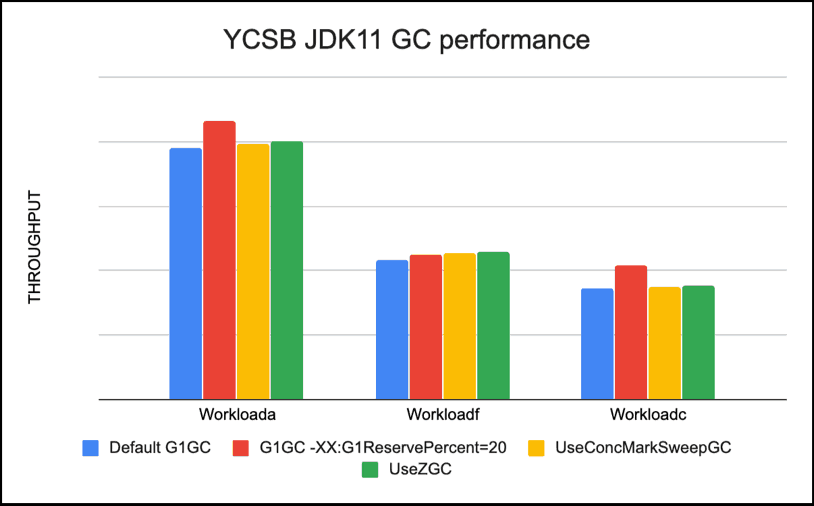
Comparing ZGC, CMS and G1GC
Running all the 3 different GCs we saw best performance with ZGC and CMS with default tuning, and for G1GC, best performance for our YCSB workloads was seen with G1GC tuning option -XX:ReservePercent=20
Using default tuning options, for Read workloads like workloada , workloadc and workloadf ZGC was 3-5% faster than G1GC default on average, CMS was 2-4% faster than G1GC default. With G1GC with -XX:ReservePercent=20 the read workloads were 10-20% faster than default G1GC.
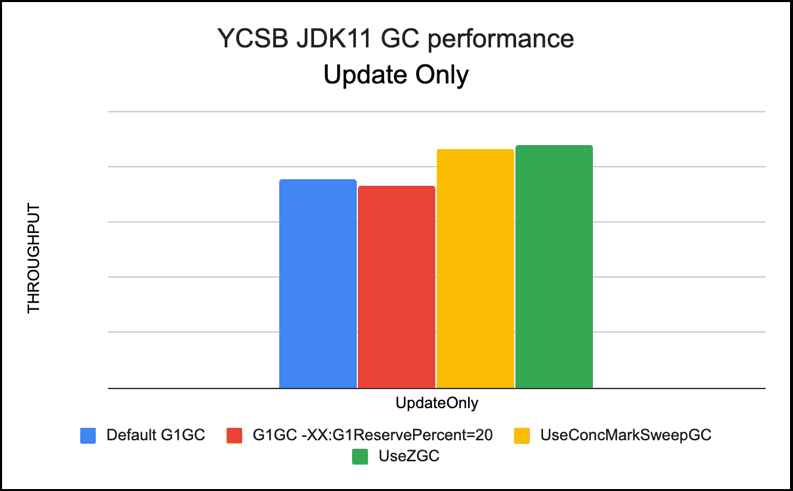
For UpdateOnly workloads ZGC was 15% faster than G1GC default on average, CMS was 14% faster than G1GC default. With G1GC with -XX:ReservePercent=20 the update workloads were 4% slower than default G1GC.
|
About YCSB
YCSB is an open-source specification and program suite for evaluating retrieval and maintenance capabilities of computer programs. It is often used to compare the relative performance of NoSQL database management systems.
The original benchmark was developed by workers in the research division of Yahoo! who released it in 2010.
- For testing 4 YCSB Workloads* were run on the cluster:
- Workload a (Read+Update): Application example: Session store recording recent actions in a user session
- 50% READ
- 50% UPDATE
- Workload f (Read+Modify+Write): Application Example: User database, where user records are read and modified by the user or to record user activity
- 50% READ
- 25% UPDATE
- 25% READ-MODIFY-WRITE
- Workload c (Read-Only): Application example: Read user profile cache, where profiles are constructed elsewhere (e.g., Hadoop)
- 100% READ
- Cloudera custom YCSB workload Update Only: Application example: Bulk updates
- 100% UPDATE operations
*Info on YCSB workloads at https://github.com/brianfrankcooper/YCSB/wiki/Core-Workloads
Test Details
- YCSB Version: 0.14.0
- YCSB Binding Version hbase20
- YCSB table @1TB scale
- JDK8 : jdk1.8.0_141
- JDK11 : java-11-openjdk-11.0.3.7-0.el7_6.x86_64
We loaded the YCSB dataset with records with each record size 1KB, creating total 1TB of data. After loading, we wait for all compaction operations to finish before starting workload test. Each workload tested was run 3 times for 15min each and the throughput* measured. The average number is taken from 3 tests to produce the final number.
*Note: Throughput (ops/sec) = No. of operations per second
Get started with CDH6.3 and JDK11 on your own workloads today. We’d love to hear feedback on what tuning works best in your environment!
Editor's Choice

