Promotional Response Curve Framework in Pharmaceutical Industry – Part 1
This article was published as a part of the Data Science Blogathon
Promotional Response Curve depicts the relationship between promotion and returns.
Introduction
There are multiple channels of promotion in pharmaceutical industries e.g. detailing, webinar, congress, medical journal, and events, etc. It is a known fact that after a certain point a promotional channel won’t impact the sales and hence we need to find that optimal value where a particular channel is most effective for brand sales.
While working for a client we found that we have just sales and rep call data and using that data we need to create a promotional response model. In this article, I will share the framework which we used to create a promotional response model.
Brief about Sales and Calls data
Calls data – It tells us the number of calls made by sales representatives to different HCP (Health Care Professional). It includes sales rep Id, the territory of the sales rep, product name, city, area, pin code, number of calls given, and HCP ID.
Sales data – It tells us the sales number of different HCO (Health Care Organizations). It includes monthly sales, HCO ID, Product Name.
Now you must have observed one thing that sales data is available at the HCO level while calls data is available at the HCP level. What does it mean??
In general, multiple HCPs are assigned to one HCO. You can understand it using the example of Apollo hospital where there are multiple doctors in different departments. All doctors have one HCP ID and Apollo hospital has one HCO ID. Therefore, you can understand how multiple HCPs are assigned to one HCO.
Now the question is how can we compare the sales and calls data??
Calls data is available at the HCP level while sales data is available at the HCO level. To compare sales and calls data we have below two options.
- We can club multiple HCPs related to one HCO and can roll up the individual HCP call to the HCO level.
- We can distribute sales to all HCPs related to one HCO
Since calls are provided at the HCP level and hence it is advisable to construct a response model at the HCP level only. Therefore we will work on the second approach.
Steps Involved in the response model
1. Analyze the calls data to find any special monthly pattern
2. Analyze the sales data to find any special pattern or seasonality
3. Distribute the sales to individual HCPs
4. Merge the calls and sales data together at the HCP level
5. Create the sales and calls lag feature
6. Create the response model equation
Below we will discuss these points in detail.
Let us assume that we have below call and sales data along with the mapping of HCP and HCO.
Sample sales data(at HCO level)

Sample call data(at HCP level)
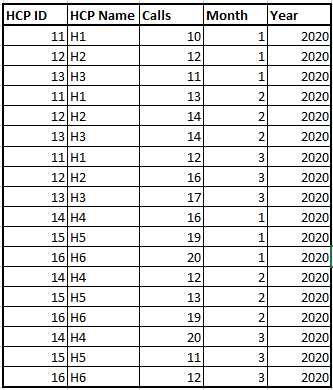
Sample mapping data of HCO to HCP

Analysis of aggregated sales data
We can aggregate sales data on monthly basis to find any pattern or seasonality. It is always good to perform EDA on the data before performing any modeling. We can check the moving average of the data to confirm if there is any abnormality in monthly sales.

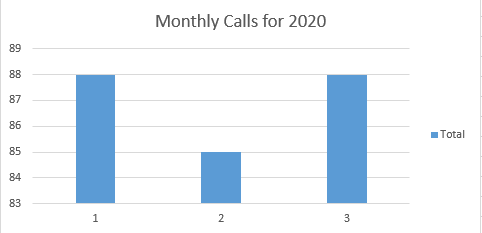
Analysis of aggregated calls data
We can also check the aggregated call data to check if the number of calls is increasing or decreasing. An important point to note here is that we have taken just calls data but in general, this call data is segregated into various other components like Face to Face calls, remote calls, events, or group calls. Therefore if we subdivide calls into different parts then the complexity will increase because you will have multiple dimensions to analyze the effect of calls on sales.
Distribution of sales to individual HCP
After the initial EDA, we will merge the sales and calls data using a mapping sheet and map HCP to HCO.
Now the important question is how we can distribute sales to multiple HCP of an HCO?
Simplest method – We can divide equal sales to all HCP. But in any hospital, there might be an HCP who is driving more sales than other HCP so we end up distributing fewer sales to that HCP.
There is another method in which we will distribute sales to HCP as per the historical calls given to them. Here our assumption is that high revenue driver HCP would be getting more calls by sales rep which is normally followed by sales rep.
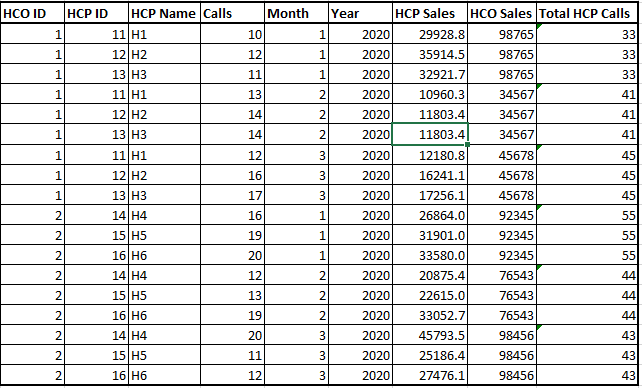
HCP Sale = HCO Sale * HCP Calls / Total HCP calls for the corresponding HCO in the specified period
You can refer to the below table in which I have merged the sales and calls data and presented the data at the HCP level where we have calls and sales for each HCP.
Creation of lag features
Now we will move to the important part of this exercise which is to create lag features for sales and calls.
Why do we need lag features ??
If a sales rep gives a call to any HCP then the immediate effect of the calls will not be seen in the present month but in the future. Hence it is important to create lag features so that we can keep an eye on the effect of historical calls on sales.
We will create 3 lag parameters for both calls and sales like below
Calls/Sales Lag parameter 1 = Previous month calls/sales
Calls/Sales Lag parameter 2 = Prior to previous month calls/sales
Calls/Sales Lag parameter 3 = Previous to lag parameter 2
How to construct a response model?
Once we have created lag parameters then we can create the below equation to construct the response model. Full working python code to construct the below equation will be available in the next part of this article.
Sales = a0 + a1*sale1 + a2*sale2 + a3*sale3 + A*(1 – exp(-C*(call + c1*call1 + c2*call2 + c3*call3)))
| Parameters | Definition |
| a0 | Base (Brand Equity) |
| A | Asymptote |
| a1,a2 and a3 | The lag coefficient for sales |
| c1.c2 and c3 | The lag coefficient for calls |
| A | asymptote |
| C | A parameter value that can be varied to generate different model output and make it linear |
Techniques to estimate parameters
- We need to make sure that we will use those parameters using which sum of square error of the model is minimum
- Parameters should be interpretable to business
- Linear/Non-Linear Regression can be used to estimate different parameters
Closing Notes
We discussed the framework of creating a promotional response curve when we have limited data (sales and calls). But we can use the above method when we have more variables of promotional activity other than calls. We just need to create lag parameters of those variables as well and need to incorporate the same in the sales equation.
Author
Himanshu Kunwar is a data science consultant helping business stakeholders across various domains with actionable data insights. You can connect with me on Linkedin.
The media shown in this article not owned by Analytics Vidhya and are used at the Author’s discretion.


