With our book, resources and workshops, we’ve shared guidance about what it takes to become a data fluent organization. Most of all, it starts with cultural habits that get people focused on using data in their decision-making. At Juice, we are working everyday to create these habits and we wanted to share how we are building a data-first mindset and where we look for inspiration.
Habit 1: Define shared metrics
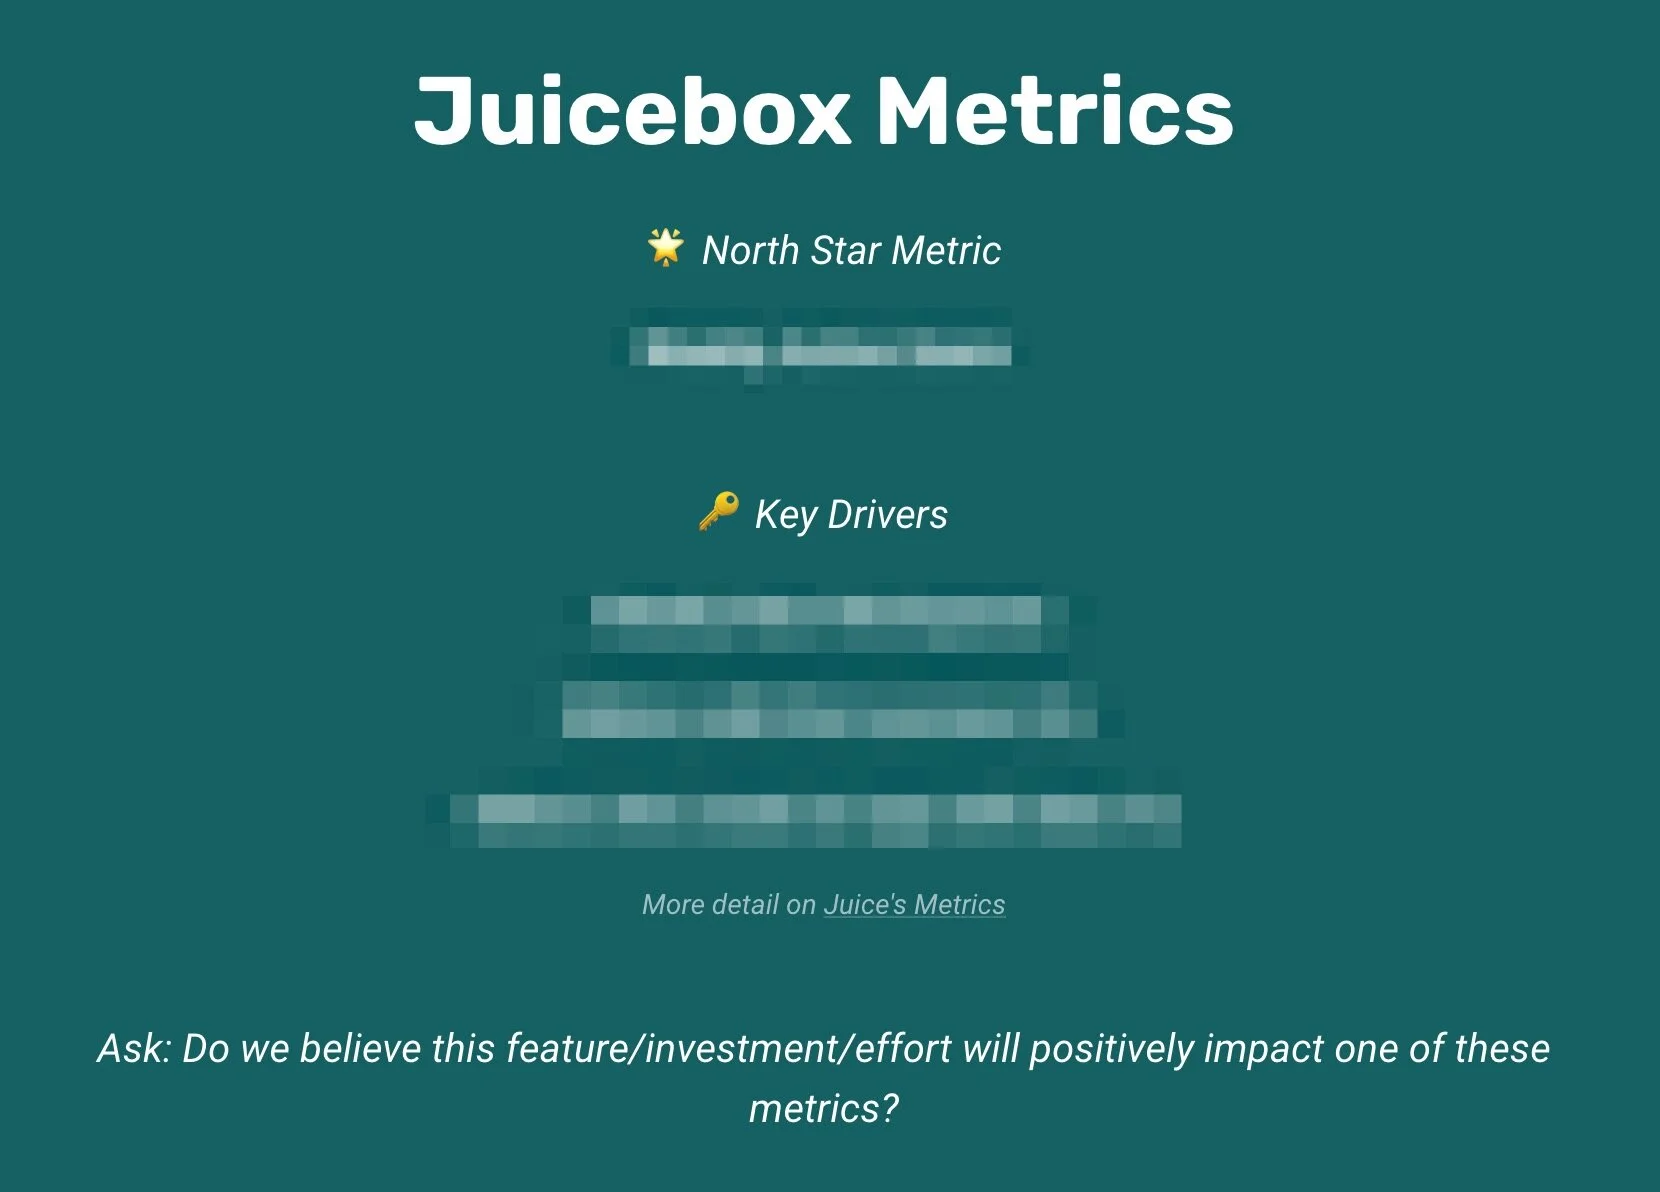
Data fluency requires getting everyone on the same page as to what matters most. Matt Lerner in conjunction with Business of Software delivers online workshops that help you determine your “North Star Metric” and the set of key drivers that are bottlenecks to achieving that overall success. He also emphasizes how the key drivers will change over time as you improve.
Habit 2: Create a shared vocabulary for your data
What is an “active user”? How do we track “first success” for a user? These are terms that need to be carefully defined and documented so we can move on to how we are going to improve them.
Val Logan of The Data Lodge is one of the premier thinkers on how organizations can build shared skills in using data. Check out her podcast: Speaking Data: Information as a Second Language

Habit 3: Evaluate the strengths and weaknesses of data sources
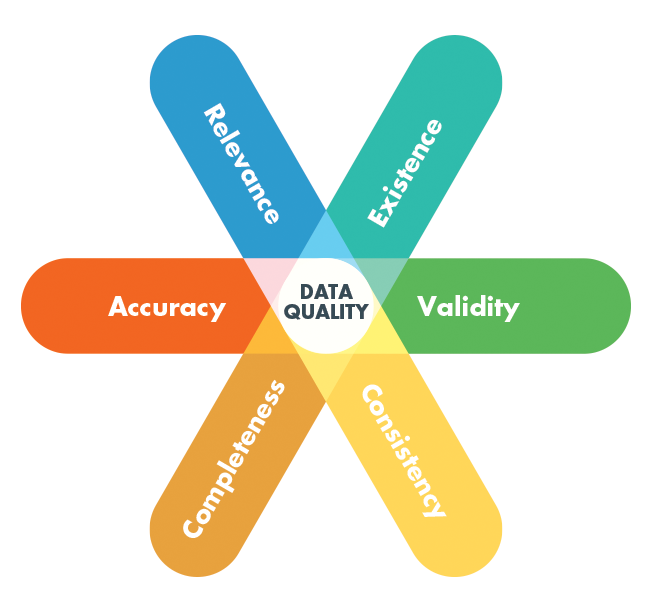
When we measure user activities for Juicebox, we have multiple 3rd-party tools and internal data sources to choose from. We needed to determine what sources are more reliably accurate, and what is the trade-off for convenience.
If you are going to lean on data, you want to understand its quality. Here’s an overview article from Neil Patel about assessing data quality.
Habit 4: Ensure transparency into how data is manipulated, modeled, and presented
You need to build alignment to avoid constantly reverting to discussions about the quality or meaning of your data. The discussion needs to move on to: What are we going to do to improve?
Alberto Cairo is a preeminent advocate for truth in presentation of data his book, How Charts Lie is a must-read on this topic.
Another thought leader in this area is Alan Schwarz, a journalist who has consistently used data to uncover hard truths.
Habit 5: Use metrics as the starting point for everyday discussions
Getting focused on a few key metrics has started to transform how we work. We start meetings by reviewing how we are performing, then focus on what activities are going to move those metrics. For difficult choices, we have shared baseline: How will it impact our North Star Metric?
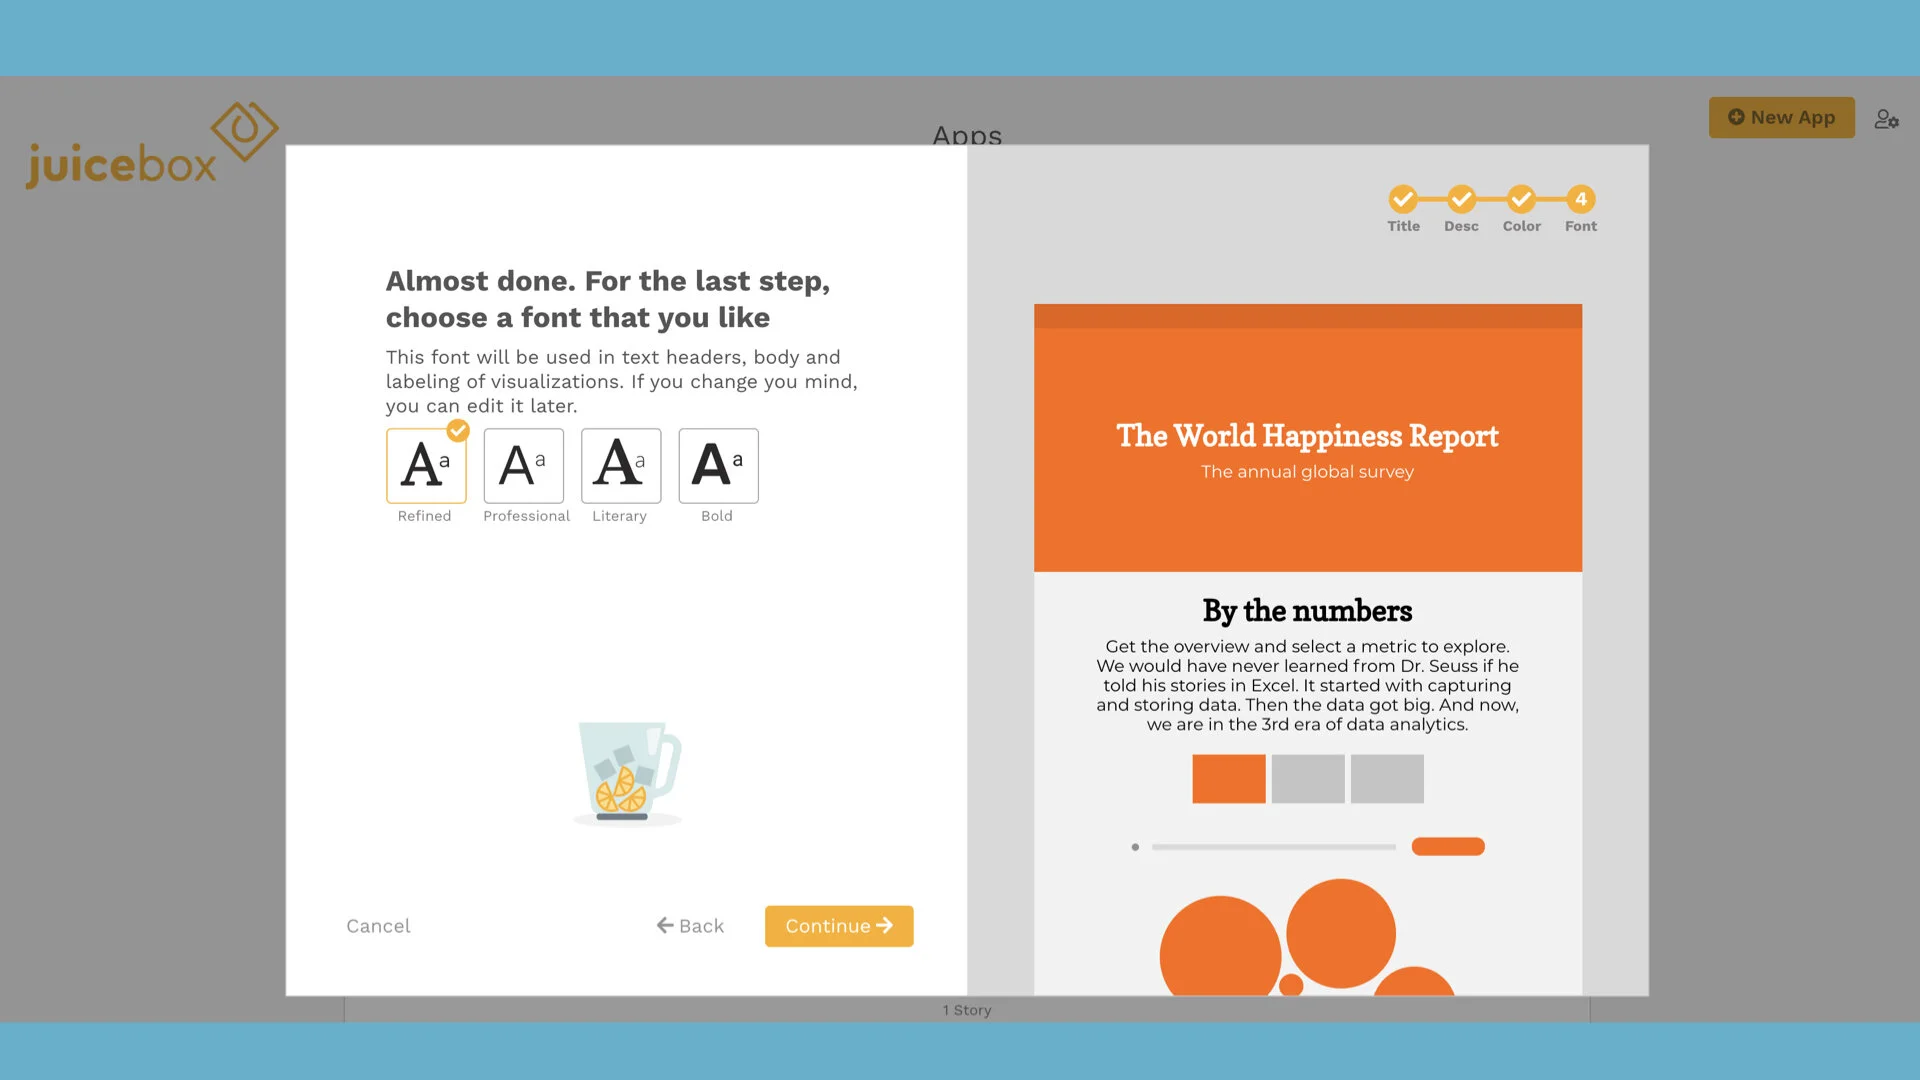
Fortunately, we have a tool in Juicebox that fluidly integrates data visualization with the ability to explain context, priorities, and next steps. It acts like a dashboard combined with a project management tool.

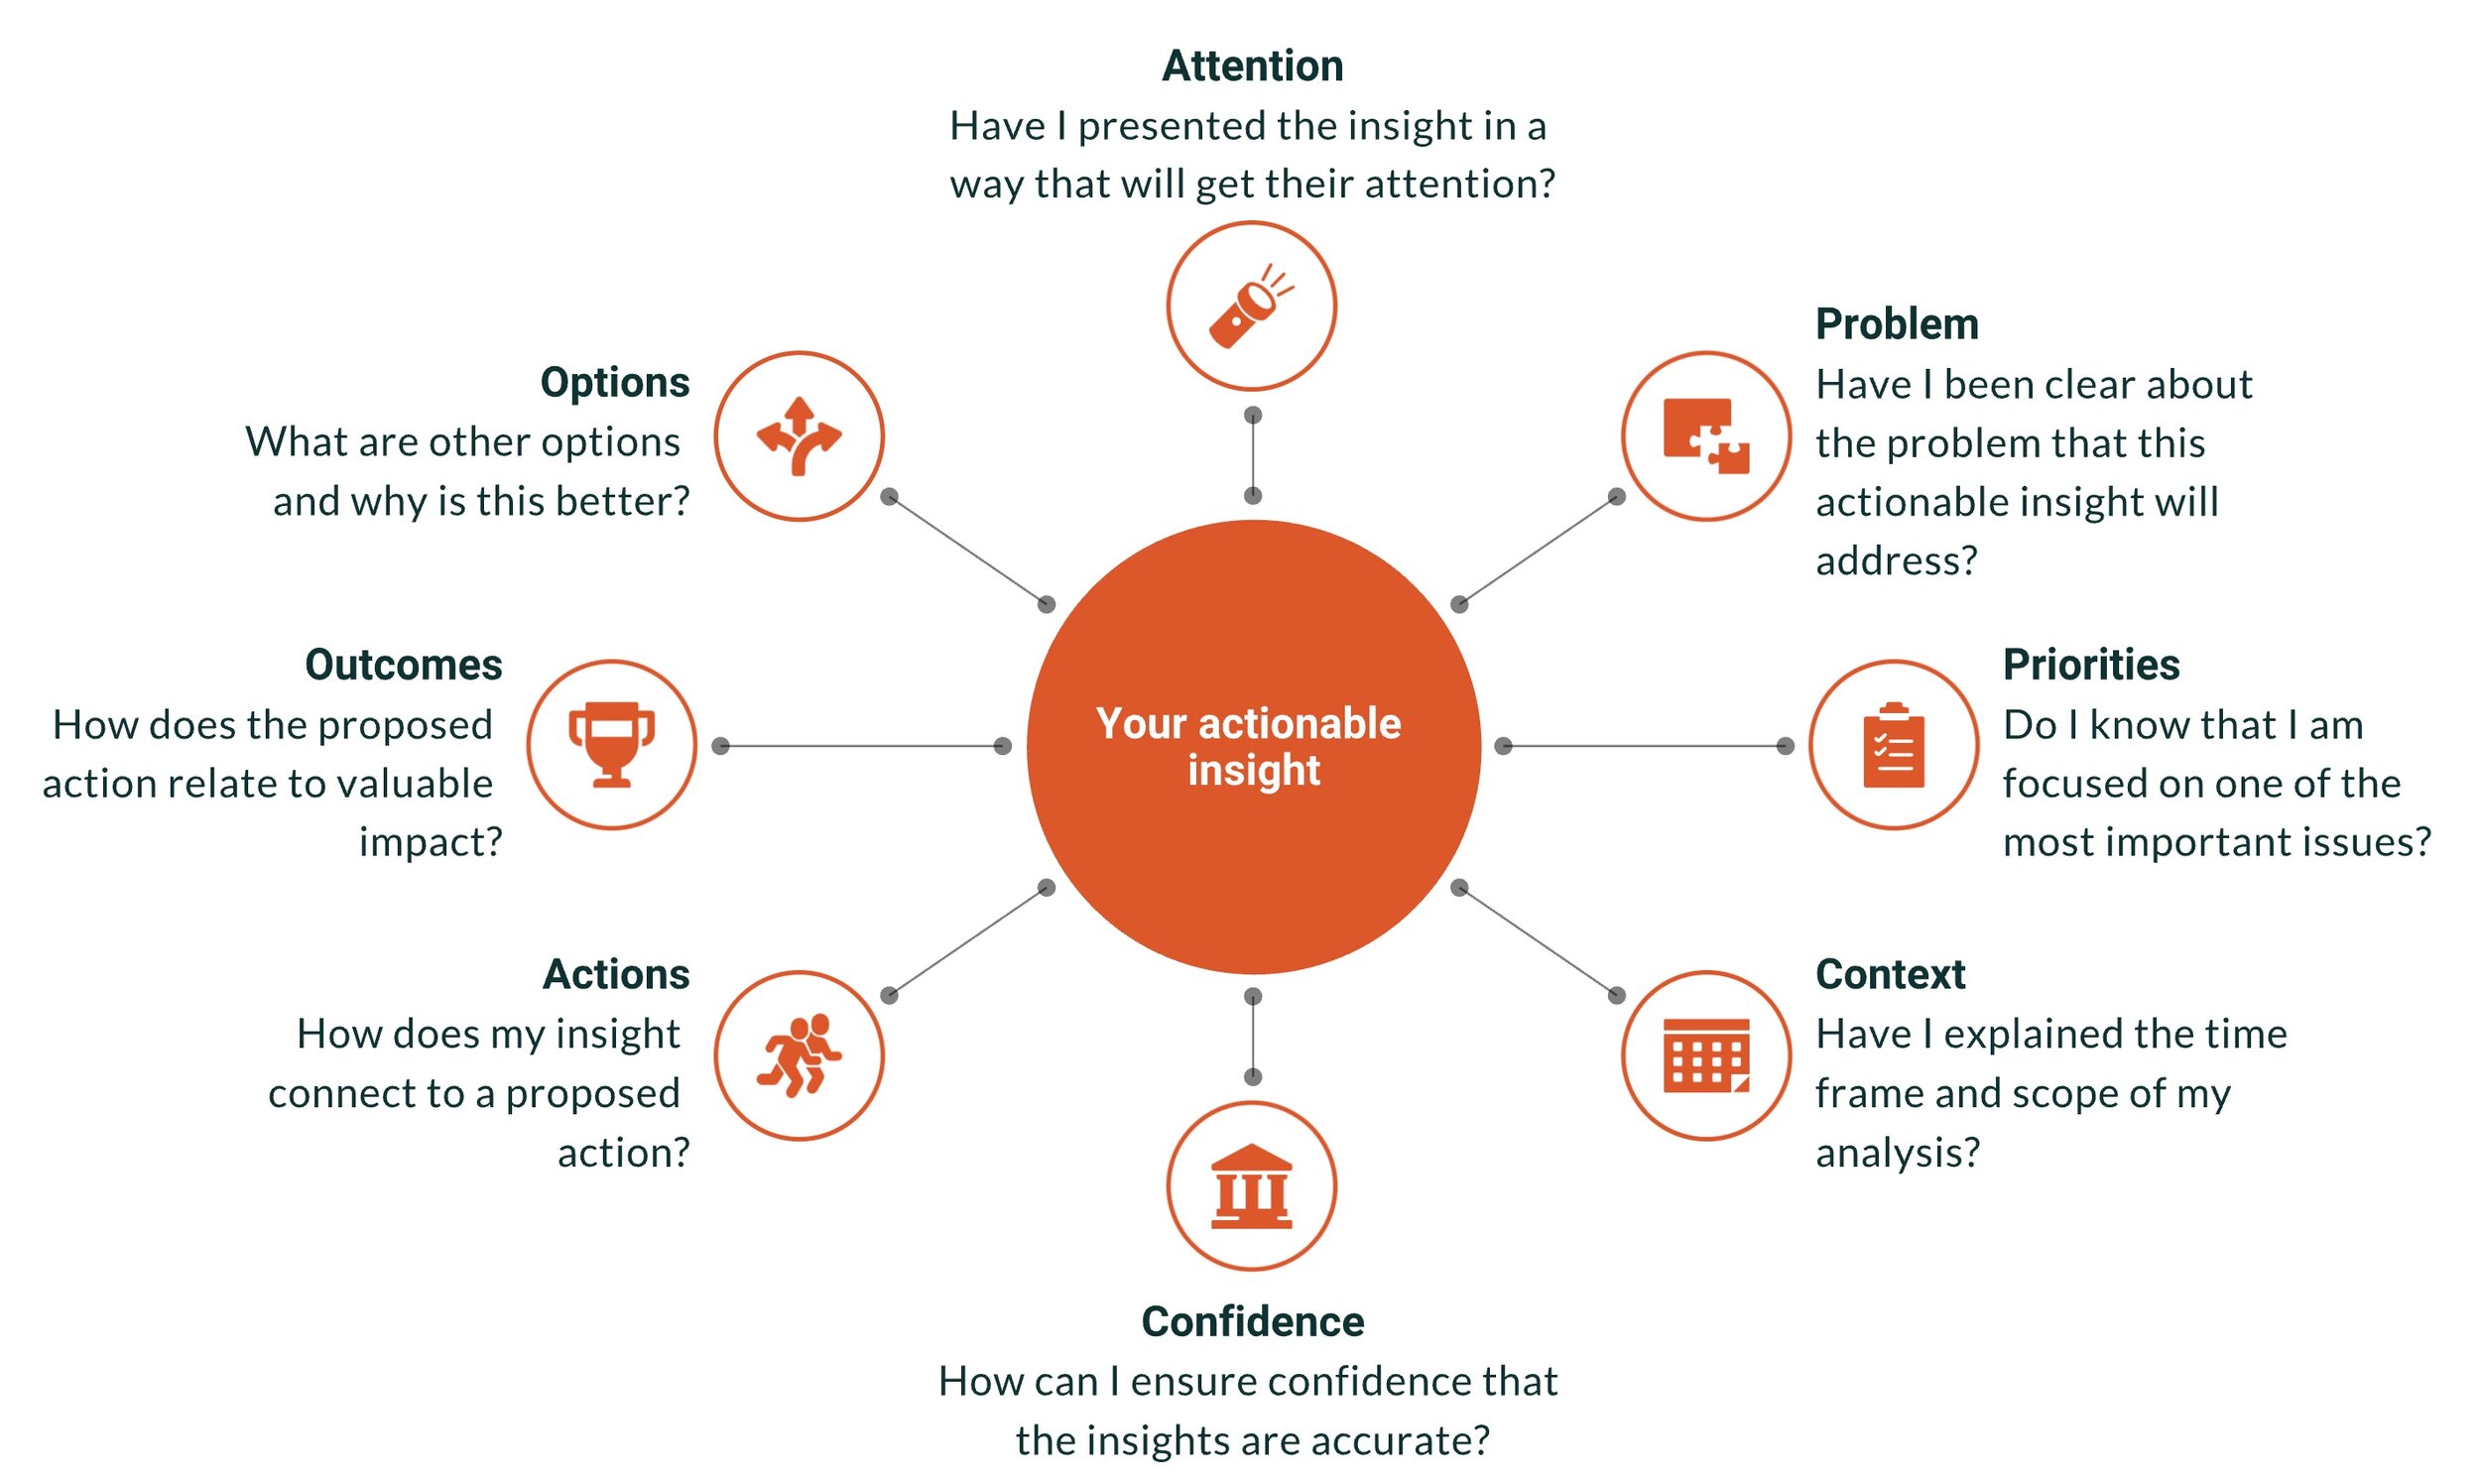
Habit 6: Established guidelines to create purposeful data products
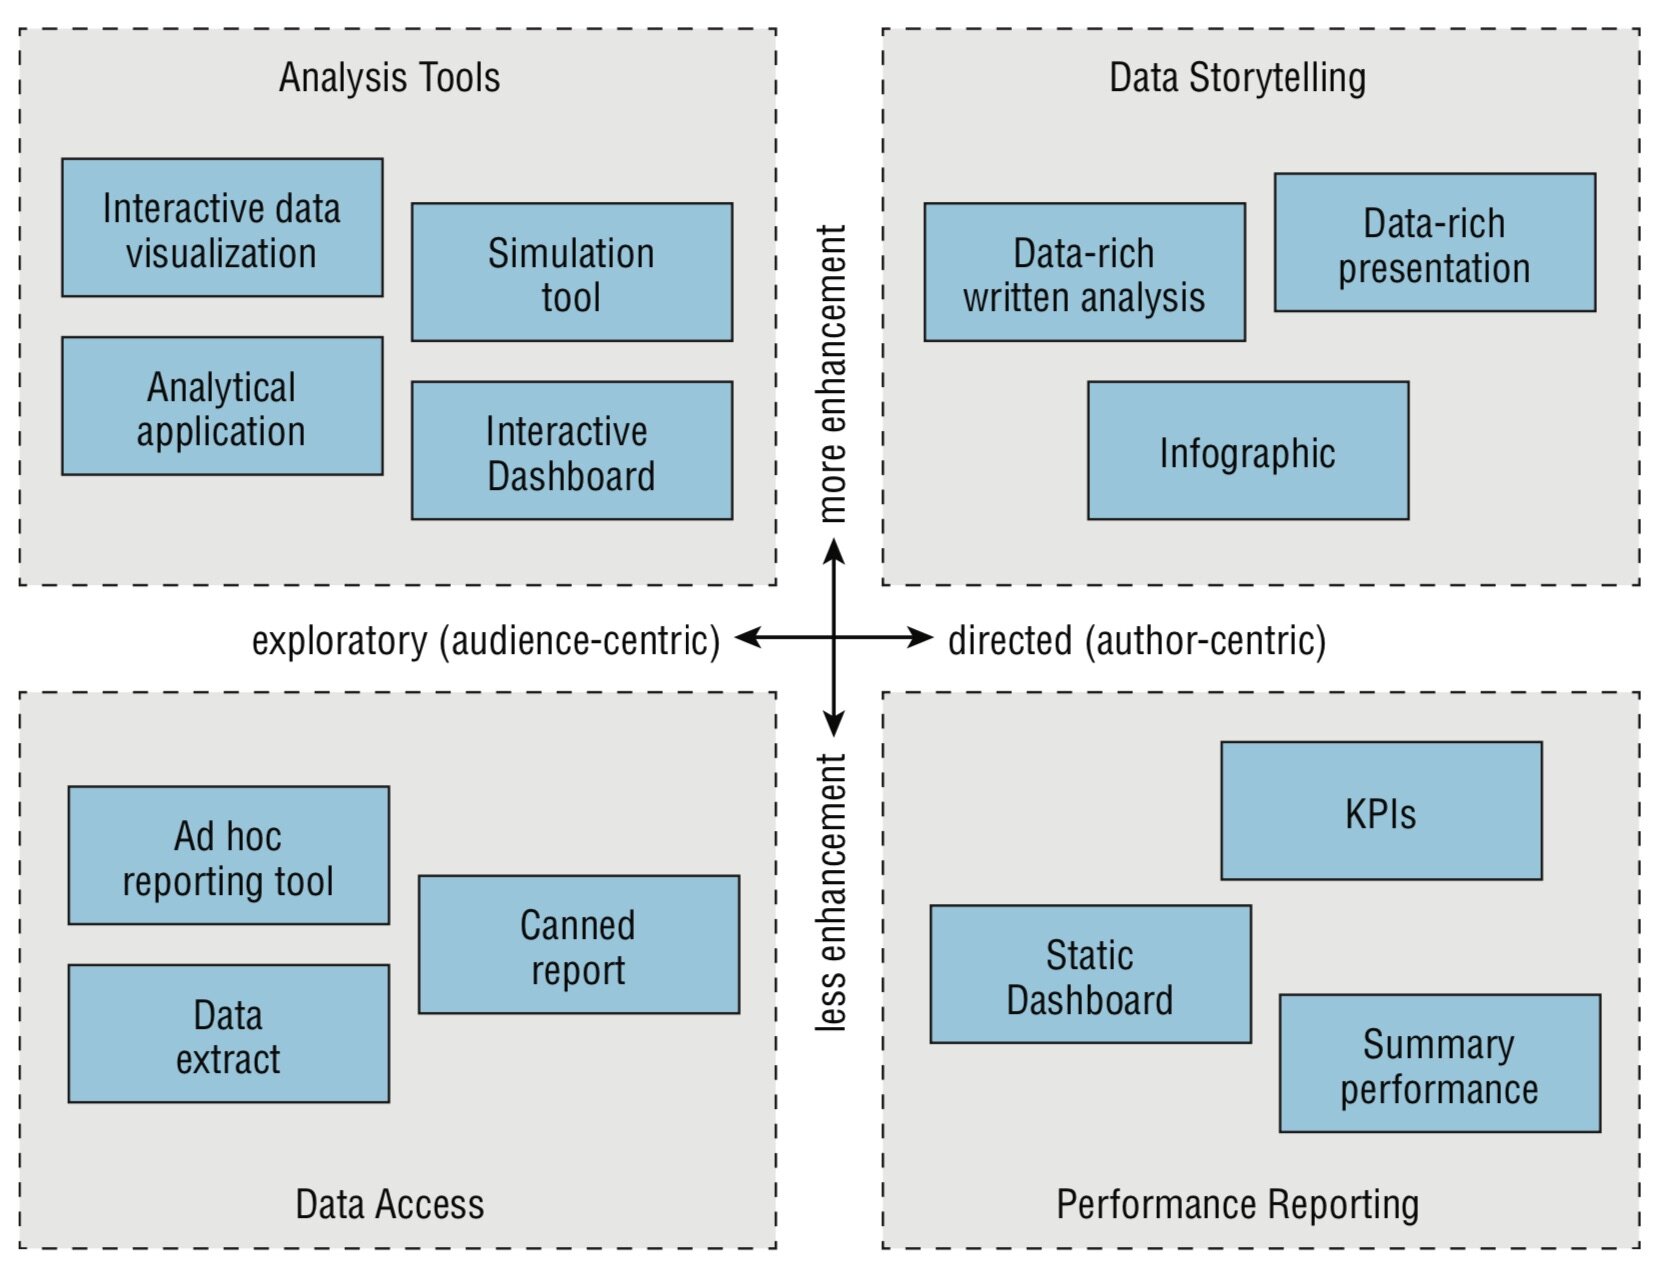
A data-eager organization will spawn plenty of reports, dashboards, and data presentation in an effort to communicate and explore. A data fluent organization will be purposeful about why each of those data products exists.
You want to start with a clear understanding of the problem you want to solve and who is going to use the information.
We created a short Data Product Checklist to help evaluate if your solution is ready to share.

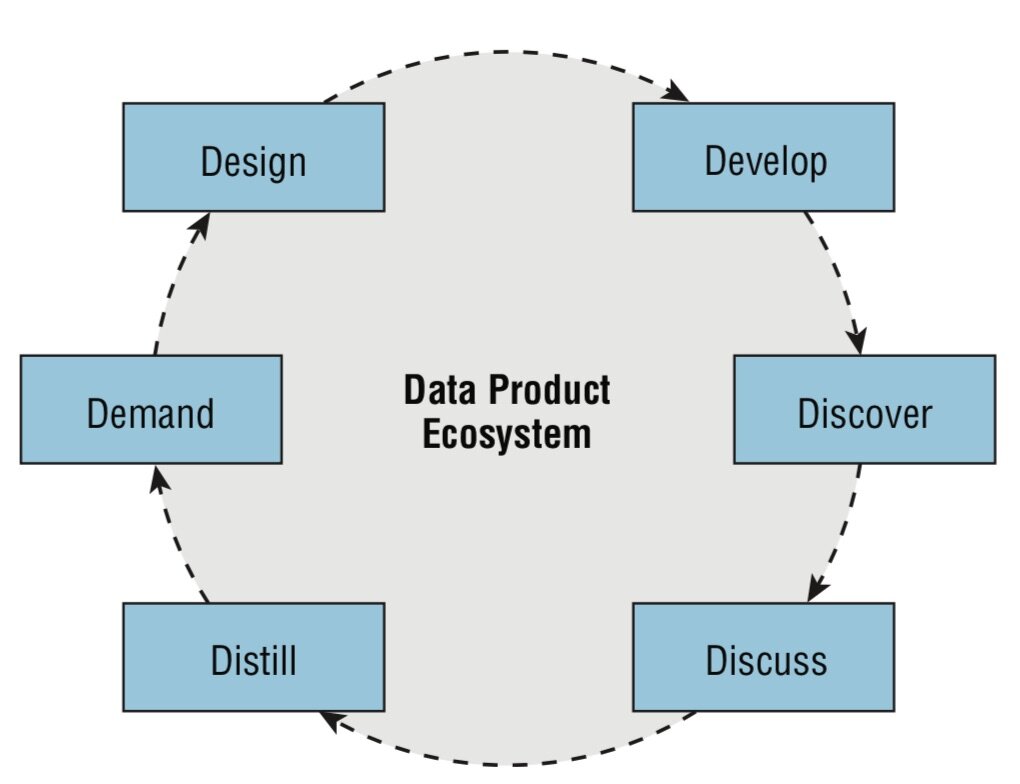
Habit 7: Develop a feedback mechanism for data products to evolve and improve
Your report or dashboard is a product. Like any other product, it needs to show value — even if you are only asking for your users’ attention. To fully discover that value, you are going to need to talk to users, improve, and iterate on the data and how you show it.
There are many ways to think about product development. We’ve found the product-led growth framework a useful set of guidelines.
Habit 8: Celebrate examples of quality data products
When you create data products that have made a difference, make a big deal out of it. These winning examples will give other groups in your organization a benchmark to pursue.
Here’s our 20 best data storytelling examples that show how to change minds with data.

Habit 9: Leadership promotes a data-driven culture
Data fluency needs to emanate from the top because people emulate the behaviors of their leaders.
Few people have been studying and advocating for data-driven cultures longer than Tom Davenport, the Surgeon General of Analytics in the Enterprise.