Mon.Oct 18, 2021

article thumbnail

Humans and AI: Bargaining Power

DataRobot

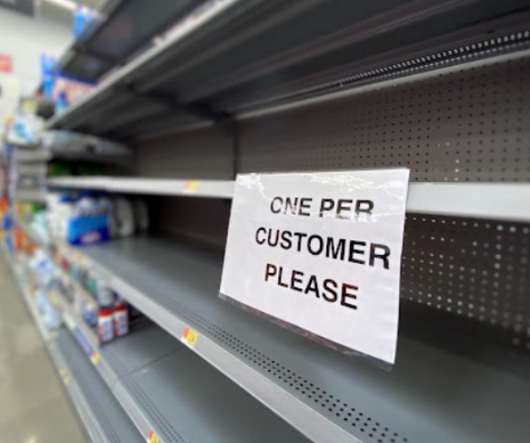
I have a confession to make—I’m a back-seat driver! When sitting in a taxi, I can’t help but grumble when the ride isn’t smooth, or the driver chooses the slowest lane of traffic. I have to fight the urge to take control. When it comes to shopping, I passively accept what is offered for sale. But my wife, who grew up in Asia where haggling is part of the culture, is different.
article thumbnail

A Guide to Machine Learning Pipelines and Orchest

Analytics Vidhya

This article was published as a part of the Data Science Blogathon Learn how machine learning pipelines are used in productions and design your first pipeline using simple steps on disaster tweets classification datasets. You will also learn how to ingest the data, preprocess, train, and eventually evaluate the results. Image 1 Introduction In this […].

Insiders

Sign Up for our Newsletter

This site is protected by reCAPTCHA and the Google Privacy Policy and Terms of Service apply.

article thumbnail

5 hot new IT jobs — and why they just might stick

DataKitchen

The post 5 hot new IT jobs — and why they just might stick first appeared on DataKitchen.

IT 356
article thumbnail

Text Analysis in Natural Language Processing using Julia

Analytics Vidhya

This article was published as a part of the Data Science Blogathon Overview of Text Analysis in Julia The article majorly focuses on how to make you comfortable with the outline of Julia text processing tools with a brief explanation of their use in projects. Here we see the TextAnalysis package of Julia with the functionalities […]. The post Text Analysis in Natural Language Processing using Julia appeared first on Analytics Vidhya.

article thumbnail

Get Better Network Graphs & Save Analysts Time

Many organizations today are unlocking the power of their data by using graph databases to feed downstream analytics, enahance visualizations, and more. Yet, when different graph nodes represent the same entity, graphs get messy. Watch this essential video with Senzing CEO Jeff Jonas on how adding entity resolution to a graph database condenses network graphs to improve analytics and save your analysts time.

article thumbnail

Our 2021 Data Impact Awards Finalists

Cloudera

It’s that time of year again… Award season! We are thrilled to announce the finalists of the 2021 Data Impact Awards. This year’s entrants have excelled at demonstrating how innovative data solutions can help solve real-time challenges and positively impact people around the world. . The entries are some of the most remarkable we’ve seen, giving our judges the tough task of selecting an award worthy shortlist.

article thumbnail

What Is Mature MLOps? A Perspective

Dataiku

On a recent webinar with Jim Kobelius of TDWI (that you can watch below), we talked about mature MLOps. You can watch our presentations, but I thought it would be helpful to summarize some of the concepts based on over ten years working with machine learning and, over the last three and a half years, specifically focusing on MLOps.

More Trending

article thumbnail

What Is Active Metadata Management and How Does It Work?

Octopai

First, what active metadata management isn’t : “Okay, you metadata! Quit lounging around! We’re gonna move those bits and bytes! Everyone, get into position and… one – and zero! And one – and zero!”. Now, what active metadata management is (well, kind of): “Okay, you metadata! Quit lounging around! You’re going to start pulling your weight here and deliver actionable insights that we can use to improve our business immediately!”.

article thumbnail

From Back-Office to Competitive Advantage - Transforming Risk in Banking

Teradata

Risk management in banks is undergoing a rapid transformation, accelerated by COVID, but with causes and potential impacts that go deeper. Find out more.

Risk 52
article thumbnail

Sankey Diagrams, Parallel Sets & Alluvial Diagrams… What’s the Difference?

The Data Visualisation Catalogue

For ages, the naming between Sankey Diagrams , Parallel Sets , and Alluvial Diagrams have been used interchangeably. Are these visualisations that different from one another and is it a bad thing that some misnaming is taking place? From my research into the various visualisation types, it’s common to see a particular visualisation type being identified under multiple names.

article thumbnail

Using MATLAB for Data Science and Machine Learning

Domino Data Lab

The opportunities to solve problems with the use of data are greater than ever, and as different industries embrace them, the available data has been steadily increasing and the number of tools expanded. A typical question that new data scientists ask is related to the best programming language to learn, either to get a good understanding of coding or to future-proof their skills.

article thumbnail

Understanding User Needs and Satisfying Them

Speaker: Scott Sehlhorst

We know we want to create products which our customers find to be valuable. Whether we label it as customer-centric or product-led depends on how long we've been doing product management. There are three challenges we face when doing this. The obvious challenge is figuring out what our users need; the non-obvious challenges are in creating a shared understanding of those needs and in sensing if what we're doing is meeting those needs.

article thumbnail

Demand Planning and Forecasting: The Key to Supply Chain Challenges

Jet Global

For years, business leaders have struggled with the challenges of getting the right product to the right place at the right time. When a company ends up with too much inventory on hand, its capital is tied up in goods stored in the warehouse, so it can’t be put to use elsewhere. Instead of paying down debt, saving on interest expense, and preserving liquidity; its cash is committed to maintaining bloated levels of inventory.