Once Upon a Time: The Evolution of Financial Data Storytelling

In the wake of the digital revolution, the business world evolved so quickly that it’s hard to appreciate just how far we’ve come. For just one example of that progress, consider financial data storytelling: a mission-critical capability that would have seemed virtually impossible just a generation ago.
Storytelling in the Age of Financial Intelligence
Financial data storytelling is a version of financial intelligence that uses the tools of narrative to explain a company’s financial position. It incorporates disparate elements including hard numbers, sophisticated visualizations, and descriptive passages to, quite literally, tell the story of finance. It explains what forces led the company to its present position, what that means for the stakeholders involved, and what the next course of action should be.
Put like that, financial data storytelling doesn’t sound particularly new or revolutionary. After all, haven’t companies always tried to make sense of the numbers? To a certain extent, yes. However, financial intelligence looks completely different when it’s framed as a narrative, both to the accountants creating the story and the executives who make up the audience. To understand why, consider where the concept of financial data storytelling came from and where it’s headed next.
The Origins of Financial Data Storytelling
Ancient Mesopotamians created the first financial ledgers, along with the field of bookkeeping. These early merchants understood the importance of financial data and began dutifully recording it in one place so they could preserve transaction details and track business-related trends. Simplistic as it may seem by today’s standards, these ledgers were the earliest attempts at financial data storytelling. Maybe more revelatory, however, is that we didn’t really improve on this technique for several thousand years.
Sure, there was the invention of double-entry bookkeeping, the codification of accounting standards, and the rise of new sources of financial data. However, in all these cases, we see the same ledger the Mesopotamians were using simply getting bigger and more complex. By the start of the 20th century, the accounting team had vastly more information with which to work, but did it really have superior financial intelligence? Probably not.
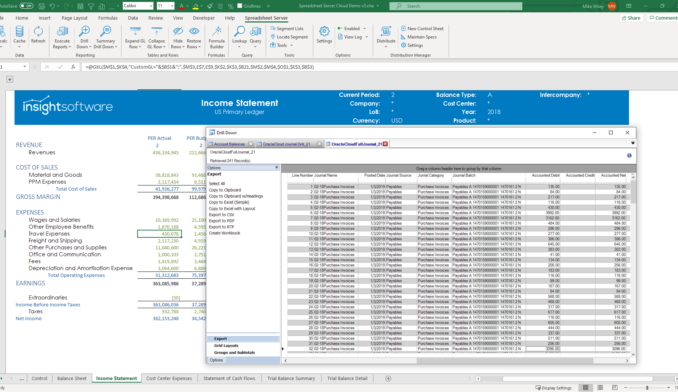
That began to change with the rise of computers and especially with the advent of software like Excel. Suddenly, accountants had an entirely new tool to organize and engage with financial data. Plus, they gained a new perspective on that data through charts and graphs. These visualizations were available before, of course, but they were extremely time- and labor-intensive to produce, and rare as a result. Thanks to Excel and software like it, financial data looked and felt different than it ever had before.
Did it actually say more, though? Efficiency and productivity undeniably improved once accountants could manipulate data on a screen instead of using paper and pen. Arguably, though, spreadsheets and ledgers are more similar than different. By being easier but not really more insightful, spreadsheets guide users toward the same standard insights, just faster; think of it as a Mesopotamian ledger combined with a microprocessor.
In hindsight, the first wave of computerized accounting may have been less innovative than advertised. We only know that, though, because the next wave proved to be so transformational. As the digital revolution gave way to the data revolution, financial data storytelling took its first major step forward in over 3,000 years.
The Future of Financial Intelligence
As is often the case, the invention of true financial data storytelling didn’t come from one breakthrough moment, but rather the confluence of many trends of developments. First and foremost, companies began collecting financial data at a speed and scale that made it possible to analyze financial performance like never before. Over the past 25 years, the degree to which companies can track performance drivers and force multipliers, both positive and negative, has expanded exponentially due to data. As a result, we can tell a much richer story simply because there’s so much more to tell.
AI-driven analytics technologies have also played an important role. Finding insights inside of financial data used to be a huge hurdle, involving hours or days of manually manipulating data to accomplish even the most basic kinds of analysis. Automation now handles most of that work so that accountants have both the time and the means to explore financial data in depth. Whatever they discover then becomes the substance of financial data storytelling.
Visualizations Elevate the Level of Storytelling
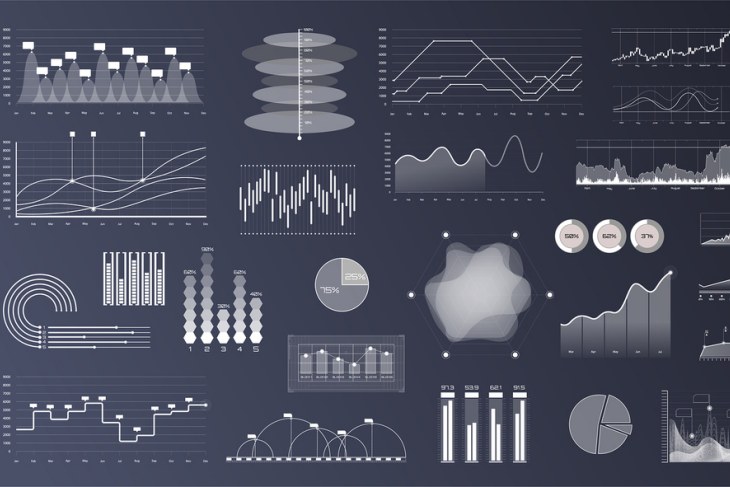
Finally, thanks to new types of data visualizations, accountants can translate data into simpler and smarter formats. Unlike the charts and graphs of before, data visualizations highlight the most important insights in the data while also calling attention to facts more obscure. They provide context, expose trends, reveal anomalies, and draw comparisons/contrasts, all while keeping the audience focused on the indicators that matter most. Without these visualizations, financial data storytelling would be little more than the bland spreadsheets and impenetrable financial reports from before.
Thanks to advances in data, analytics, and visualizations, financial data storytelling isn’t just possible, it’s relatively easy.
Here’s a quick hypothetical:
A CFO wants to tell the story of financial performance over the previous quarter to the rest of the C-suite. He identifies the metrics and data he wants to use and tracks down the latest numbers with a few clicks. From there, he translates some of the numbers into visualizations, others into narrative passages, and he builds a narrative to bind everything together. The resulting story shows the rest of the C-suite what went right and wrong over the last quarter, why, and what the implications are. That way, the audience gains high-level financial insights, which they can then use to apply better financial judgment in their own corner of the enterprise, all without needing an in-depth financial background.
To help underscore what makes the advent of financial data storytelling so important, consider the results of a recent McKinsey survey showing that 80 percent of respondents believe their organization struggles with decision making. That could be caused by many things, including incomplete, irrelevant, outdated, or inaccurate data most commonly. In all cases, the tools and techniques of data storytelling would help. With the right data and the right story around it, there are fewer obstacles to decision making and fewer consequences caused by acting unwisely.
Financial data storytelling is still in its infancy. For all that it has revolutionized accounting and financial decision making already, its biggest impact is yet to come. That leaves companies with a simple choice to make: Get good at telling stories now or hurry to catch up later after it’s a liability not to know.
If you would rather lead than follow, insightsoftware has a suite of financial reporting tools that make it easy to turn data into compelling stories. Think of our tools as your translator, taking data in its raw state and transforming it into something optimized for decision making.
To learn more about how to transform your financial data into a compelling story, download our whitepaper “The Evolution of the CFO into the Chief Data Storyteller: Turning Numbers into Narrative.”


