
This article covers a couple of key Machine Learning (ML) vital signs to consider when tracking ML models in production to ensure model reliability, consistency and performance in the future. Many thanks to Don Miner for collaborating with Domino on this article. For additional vital signs and insight beyond what is provided in this article, attend the webinar.
Machine Learning Models: Running Wild
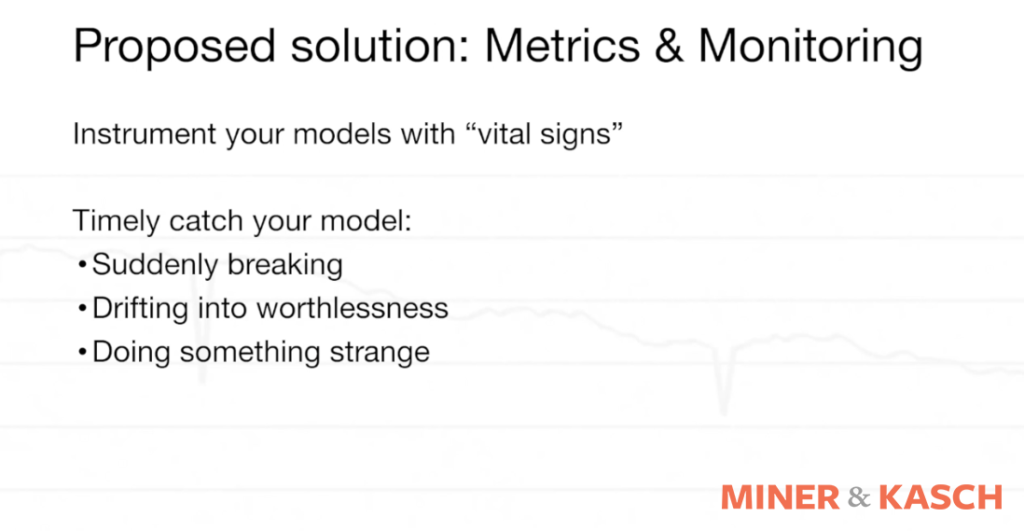
Many data scientists, ML researchers and their model-driven organizations have developed a model to solve a specific problem. They may also experience relief when the model "works" in production. Yet, what happens when there are hundreds of models running in production and interacting with the real world? What happens when no one is keeping track of how the models are performing on live data? Unfortunately, bias and variance can creep into models over time, which can cause them to drift into worthlessness. These outcomes are not ideal for producing a positive impact on the business.
As Domino seeks to accelerate research and reinforce data scientists' positive impact upon their companies, we reached out to Don Miner to collaborate on a webinar, "Machine Learning Vital Signs: Metrics and Monitoring Models in Production,” that details metrics and monitoring, or the tracking of machine learning models in production to ensure model reliability, consistency and performance into the future. Miner's prior experience as a data scientist, engineer, and CTO contributes to his unique and pragmatic perspective. This blog post includes slide excerpts and a couple of key ML vital signs including accuracy and output distribution, and you can attend the full webinar for more vital signs and in-depth insights.
What Are ML Vital Signs?
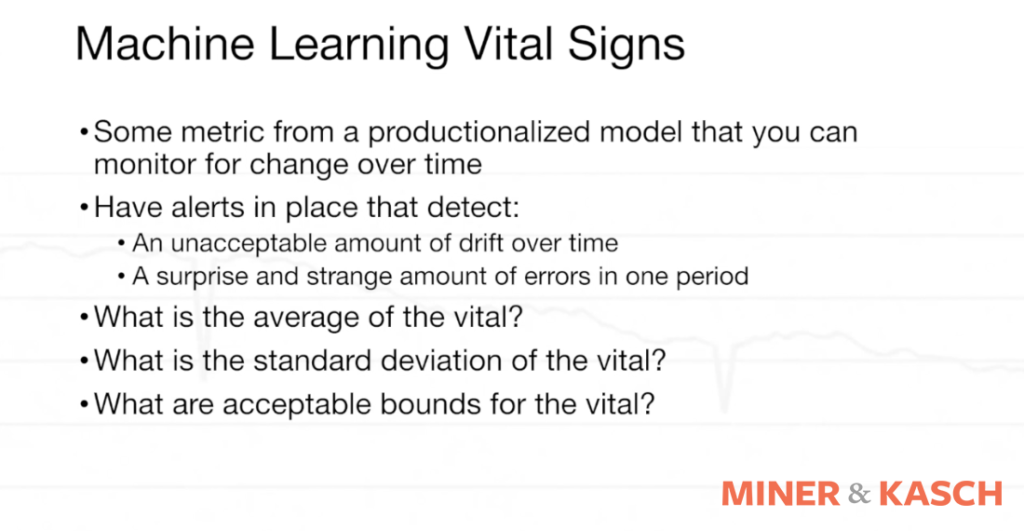
Miner advocates for using a vital sign or a metric from a productionalized model that can be measured over time. This is beyond the traditional metric of "is the model working? Yes or No." This additional metric helps determine if the models are doing what they are supposed to be doing, over time.
ML Vital Sign: Accuracy
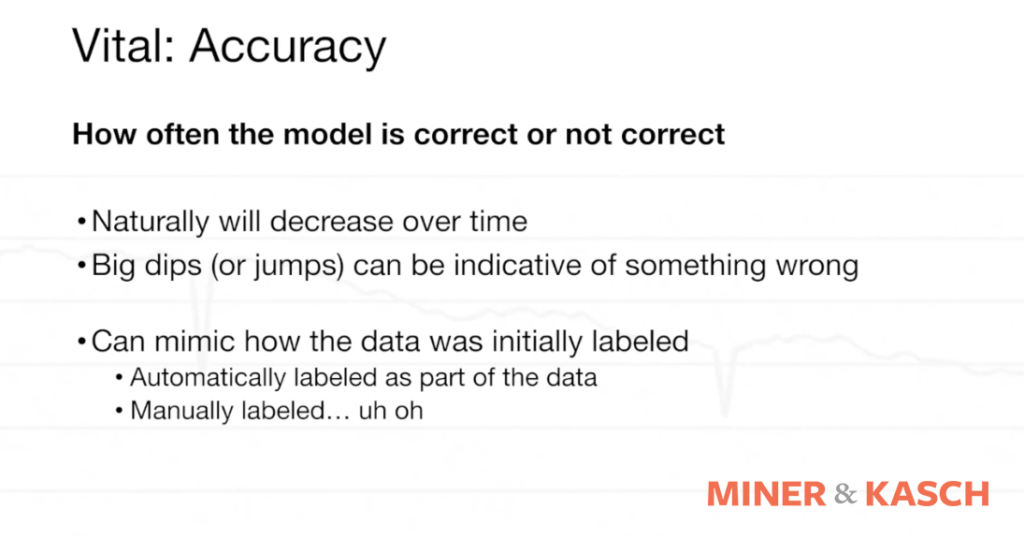
Accuracy is a core "vital sign". It addresses questions that include: Is the model accurate or not? Is it correct? Is it doing exactly what it’s supposed to be doing? Is it right more often than wrong? Leveling up accuracy may occur when retraining the model on new data, particularly if ML researchers have set up a system for retraining the model every month or so. Yet, the model may experience a gradual decrease in accuracy over time.
The model may decrease in accuracy because the decisions researchers made around hyperparameter tuning and the type of model used during the initial development may no longer be as appropriate over time. Also, anytime there is a big dip or a big jump in accuracy that may be indicative of something going on.
ML Vital Sign: Challenge with Accuracy
A challenge with accuracy makes it really useful in some cases, but not useful in others. For example, how do we measure whether we got something right or wrong? The model produced an output. Yet, the model is predicting something we don't know. If we don't know what the output should be, at some point in time, then we can't really measure accuracy. Miner refers to an HR employee-churn use case as an example. A company was seeking to predict whether or not an employee was at risk for leaving within the next 18 months. Inside of those 18 months, there was a percentage chance that the employee was going to leave and in what timeframe they might leave. Then 18 months later, the company would know whether the model had been accurate 18 months ago. From a pragmatic perspective, 18 months is too long to identify that there is a problem in your model. This is an example of the challenge with relying only on accuracy for certain use cases or workflows. When accuracy is not enough, there are alternative vital signs to consider.
ML Vital Sign: Output Distribution
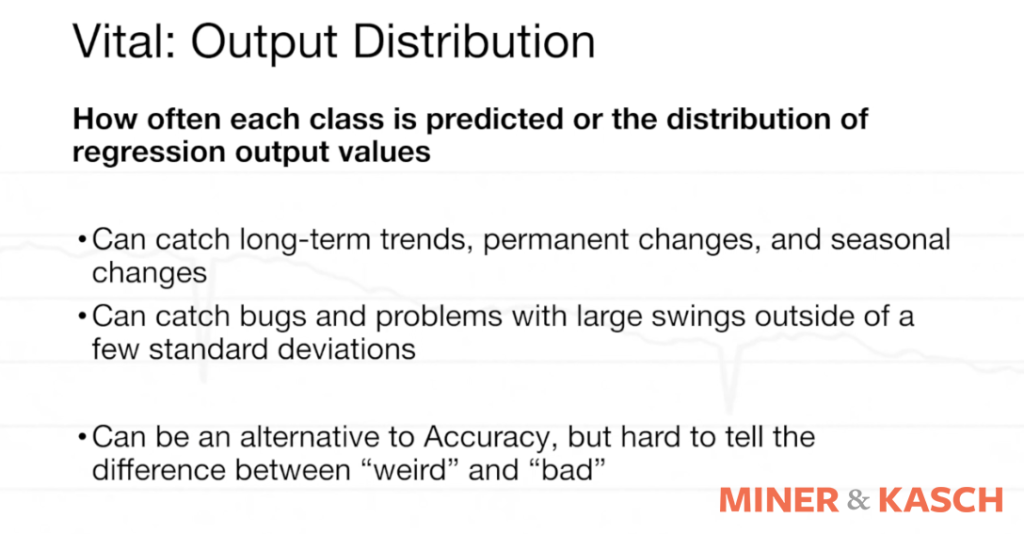
One alternative to the accuracy vital sign is output distribution. The output distribution is counting or summarizing what the model is returning from the inputs it is given. In a classification model, this is counting the output labels the model is outputting in production. In a regression model, this could be a more complex distribution, a quantile analysis, or simply an average. This metric helps detect problems if there are significant changes to the output distribution from previous models. Either the world has changed so significantly that the output distribution is changed, or the model is changed significantly that the output distribution has changed. Either way, it’s something to look into to make sure the model is still performing well. This is all done without actually knowing if the model is correct or not, but just watching the shift in behavior can indicate something a human should investigate.
Conclusion
As Domino seeks to support data scientists and researchers accelerate their work, we reached out to Don Miner to collaborate on a webinar "Machine Learning Vital Signs: Metrics and Monitoring Models in Production". While this blog post includes slide excerpts and a couple of key ML "vital signs" including accuracy and output distribution, for more vital signs and in-depth insights, attend the full webinar or read our whitepaper on model monitoring.
The full webinar covers
- why you should invest time in monitoring your machine learning models.
- real-world anecdotes about some of the dangers of not paying attention to how a model’s performance can change over time.
- metrics you should be gathering for each model and what they tell you with a list of vital signs, what value they provide and how to measure them.
- vital signs that include classification label distribution over time, distribution of regression results, measurement of bias, measurement of variance, change in output from previous models and changes in accuracy over time.
- implementation strategies to keep watch on model drift over time.

Ann Spencer is the former Head of Content for Domino where she provided a high degree of value, density, and analytical rigor that sparks respectful candid public discourse from multiple perspectives, discourse that’s anchored in the intention of helping accelerate data science work. Previously, she was the data editor at O’Reilly, focusing on data science and data engineering.


Subscribe to the Domino Newsletter
Receive data science tips and tutorials from leading Data Science leaders, right to your inbox.
By submitting this form you agree to receive communications from Domino related to products and services in accordance with Domino's privacy policy and may opt-out at anytime.