The Most In Demand Tech Skills for Data Scientists
By the end of this article you’ll know which technologies are becoming more popular with employers and which are becoming less popular.
By Jeff Hale, Data Scientist, Author, Ecommerce COO
In fall of 2018 I analyzed the most in demand skills and technologies for data scientists. That article resonated with folks. It has over 11,000 claps on Medium, was translated into several languages, and was the most popular story on KD Nuggets for November 2018.
A little over a year has passed. Let’s see what’s new. ????
By the end of this article you’ll know which technologies are becoming more popular with employers and which are becoming less popular.
In my original 2018 article I looked at demand for general skills such as statistics and communication. I also looked at demand for technologies such as Python and R. Software technologies change must faster than demand for general skills, so I include only technologies in this updated analysis.
I searched SimplyHired, Indeed, Monster, and LinkedIn to see which keywords appeared with “Data Scientist” in job listings in the United States. This time I decided to write the code to scrape the job listings instead of searching by hand. This endeavor proved fruitful for SimplyHired, Indeed, and Monster. I was able to use the Requests and Beautiful Soup Python libraries. You can see the Jupyter notebook with the code for the scraping and analysis at my GitHub repo.
Scraping LinkedIn proved far more arduous. Authentication is required to see an exact count of job listings. I decided to use Selenium for headless browsing. In September 2019, a United States Supreme Court case was decided against LinkedIn, allowing LinkedIn’s data to be scraped. Nonetheless, I was unable to access my account after several scraping attempts. This issue might have stemmed from rate limiting. ???? Update: I’m back in now, but concerned I’ll get locked out if I try to scrape it again.
For what it’s worth, Microsoft owns LinkedIn, Randstad Holding owns Monster, and Recruit Holdings owns Indeed and SimplyHired.
LinkedIn’s data might not have provided an apples-to-apples comparison from last year to this year, anyway. This summer I noticed that LinkedIn started having huge fluctuations from week to week for some tech job search terms. I hypothesize that they might have been experimenting with their search results algorithm by using natural language processing to gauge intent. In contrast, relatively similar numbers of job listings for ‘Data Scientist’ appeared for the three other search sites over both years.
For these reasons, I excluded LinkedIn from the analysis for 2019 and 2018 in this article.


For each job search website, I calculated the percentage of total data scientist job listings for that site that each keyword appeared in. I then averaged those percentages across the three sites for each keyword.
I manually investigated new search terms and scraped those that looked promising. No new terms reached an average of five percent of listings in 2019, the cutoff I used for inclusion in the results below.
Let’s see what we found! ????
Results
There are at least four ways to look at the results for each keyword:
- For each job site, for each year, divide the number of listings with the keyword in them by the total number of search terms that include data scientist. Then take the average of the three job sites. This is the process described above.
- After doing number 1 above, take the change in the average percentage of listings from 2018 to 2019.
- After doing number 1 above, take the percentage change of the average percentage of listings from 2018 to 2019.
- After doing number 1 above, compute the rank for each keyword relative to other keywords for that year. Then calculate the change in rank from one year to the next.
Let’s look at the first three options with bar charts. Then I’ll show a table with the data and discuss the results.
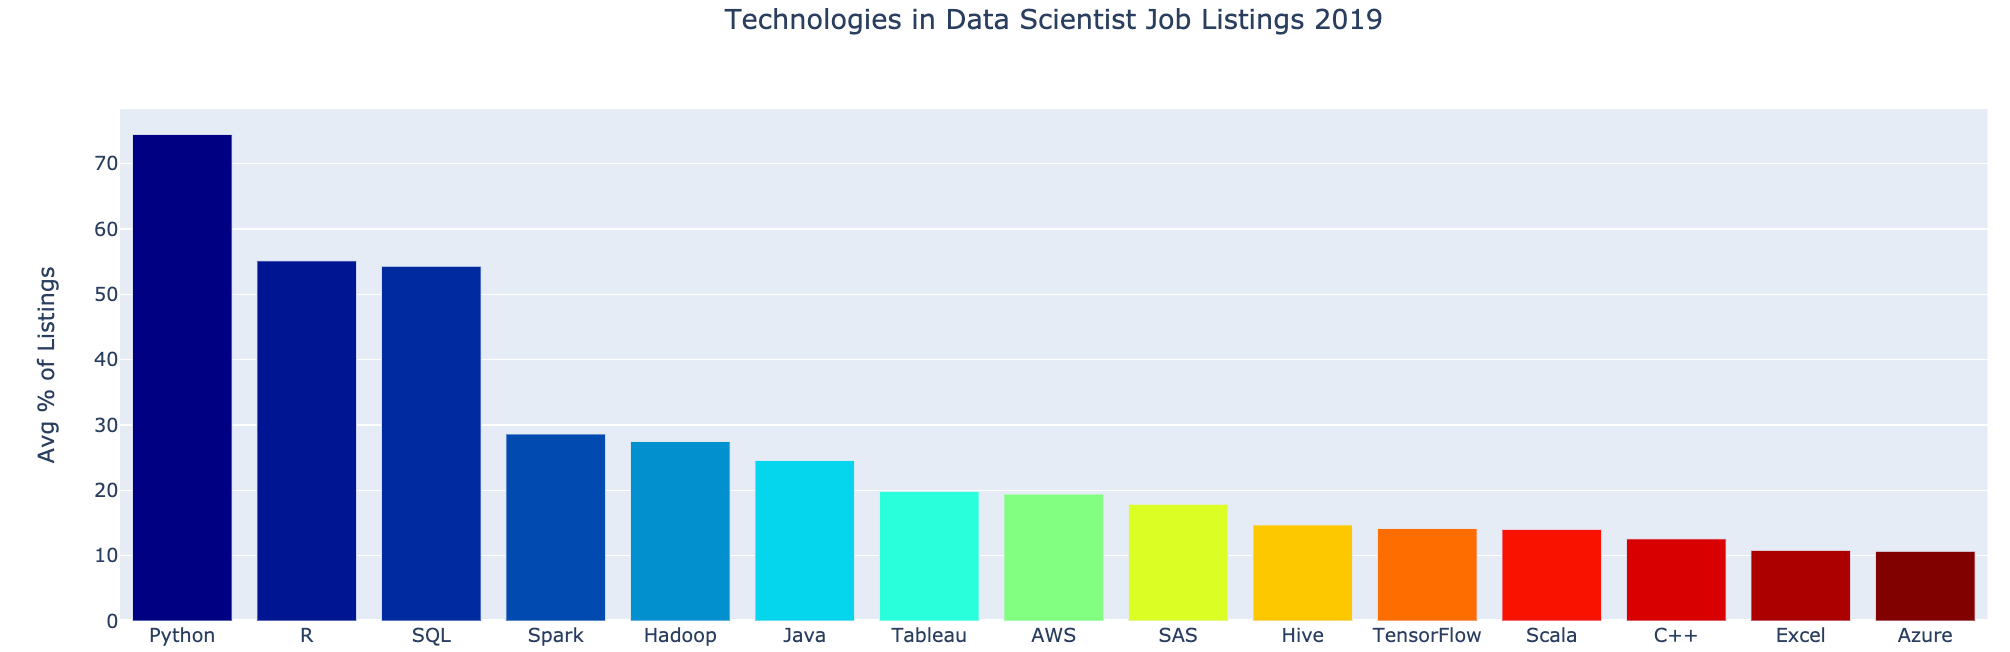
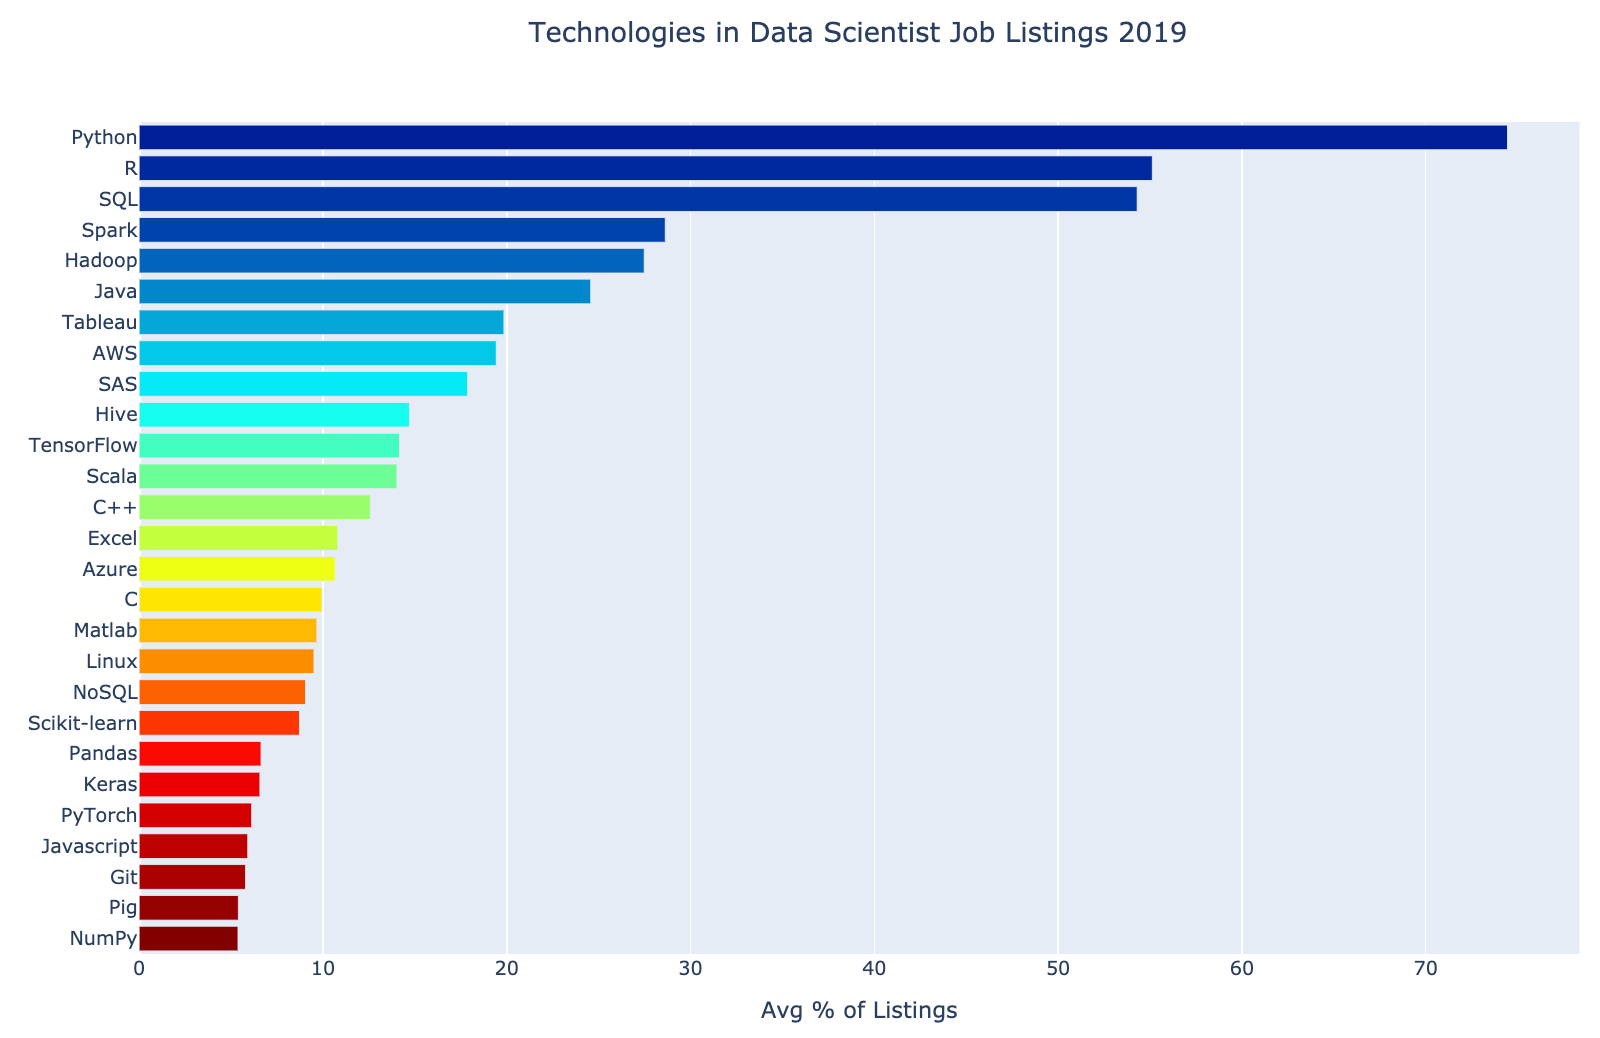
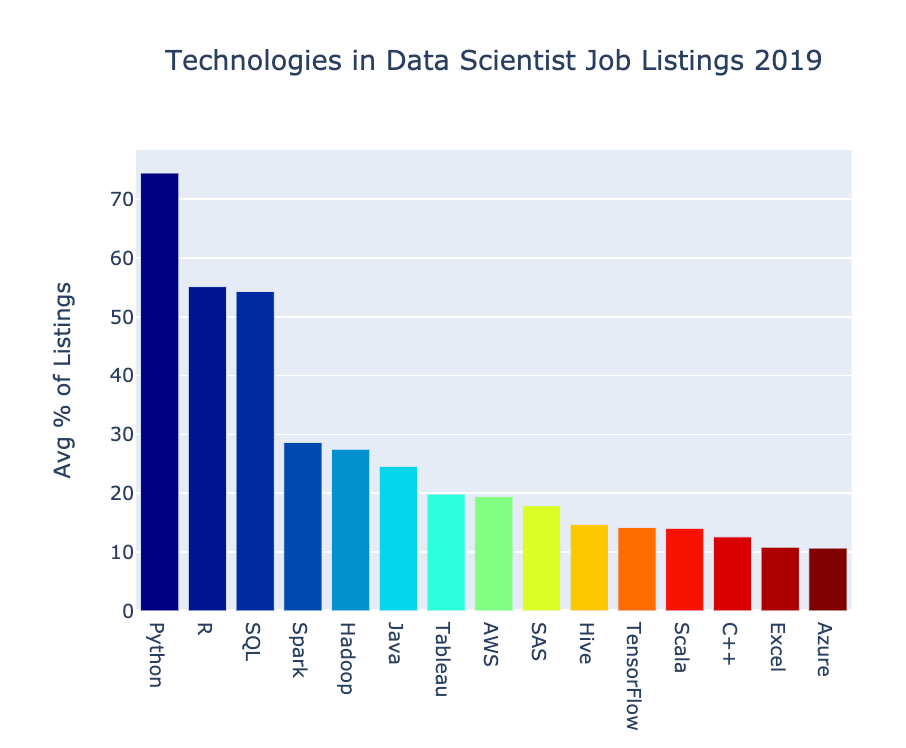
Here’s chart from number 1 above for 2019, showing that Python appears in nearly 75% of listings.
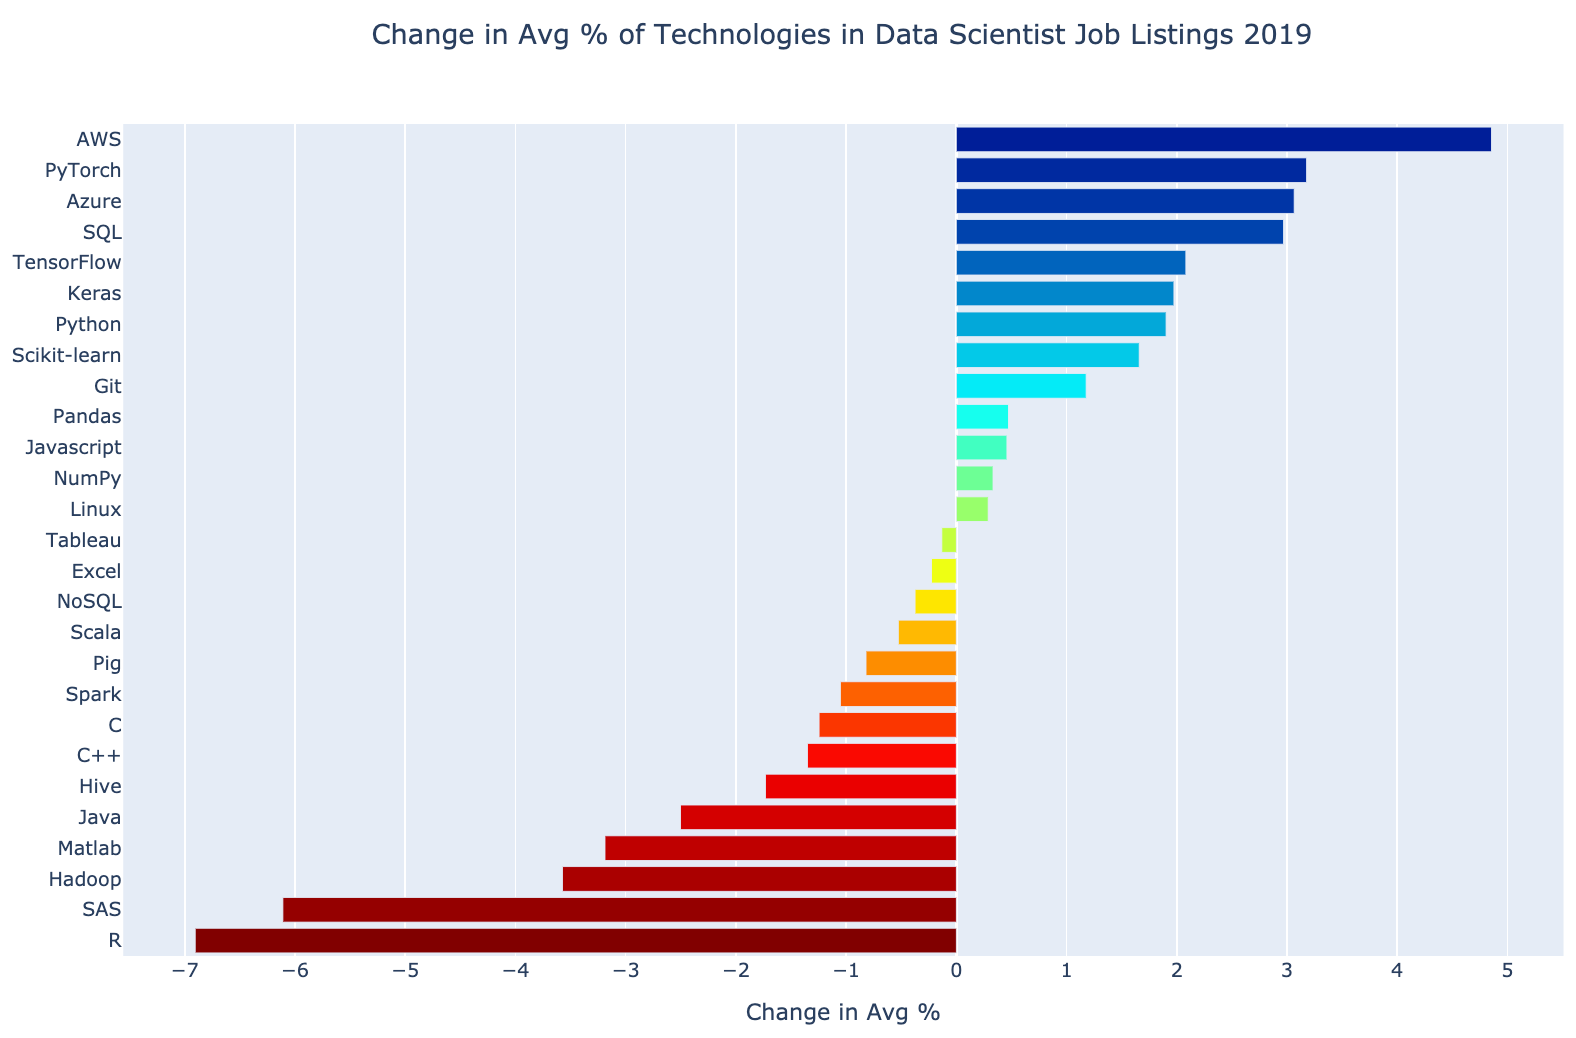
Here’s the chart from number 2 above, showing the gains and losses in terms of the average percentage of listings between 2018 and 2019. AWS show an increase of 5% points. It appeared in an average of 19.4% of listings in 2019 and an average of 14.6% of listings in 2018.
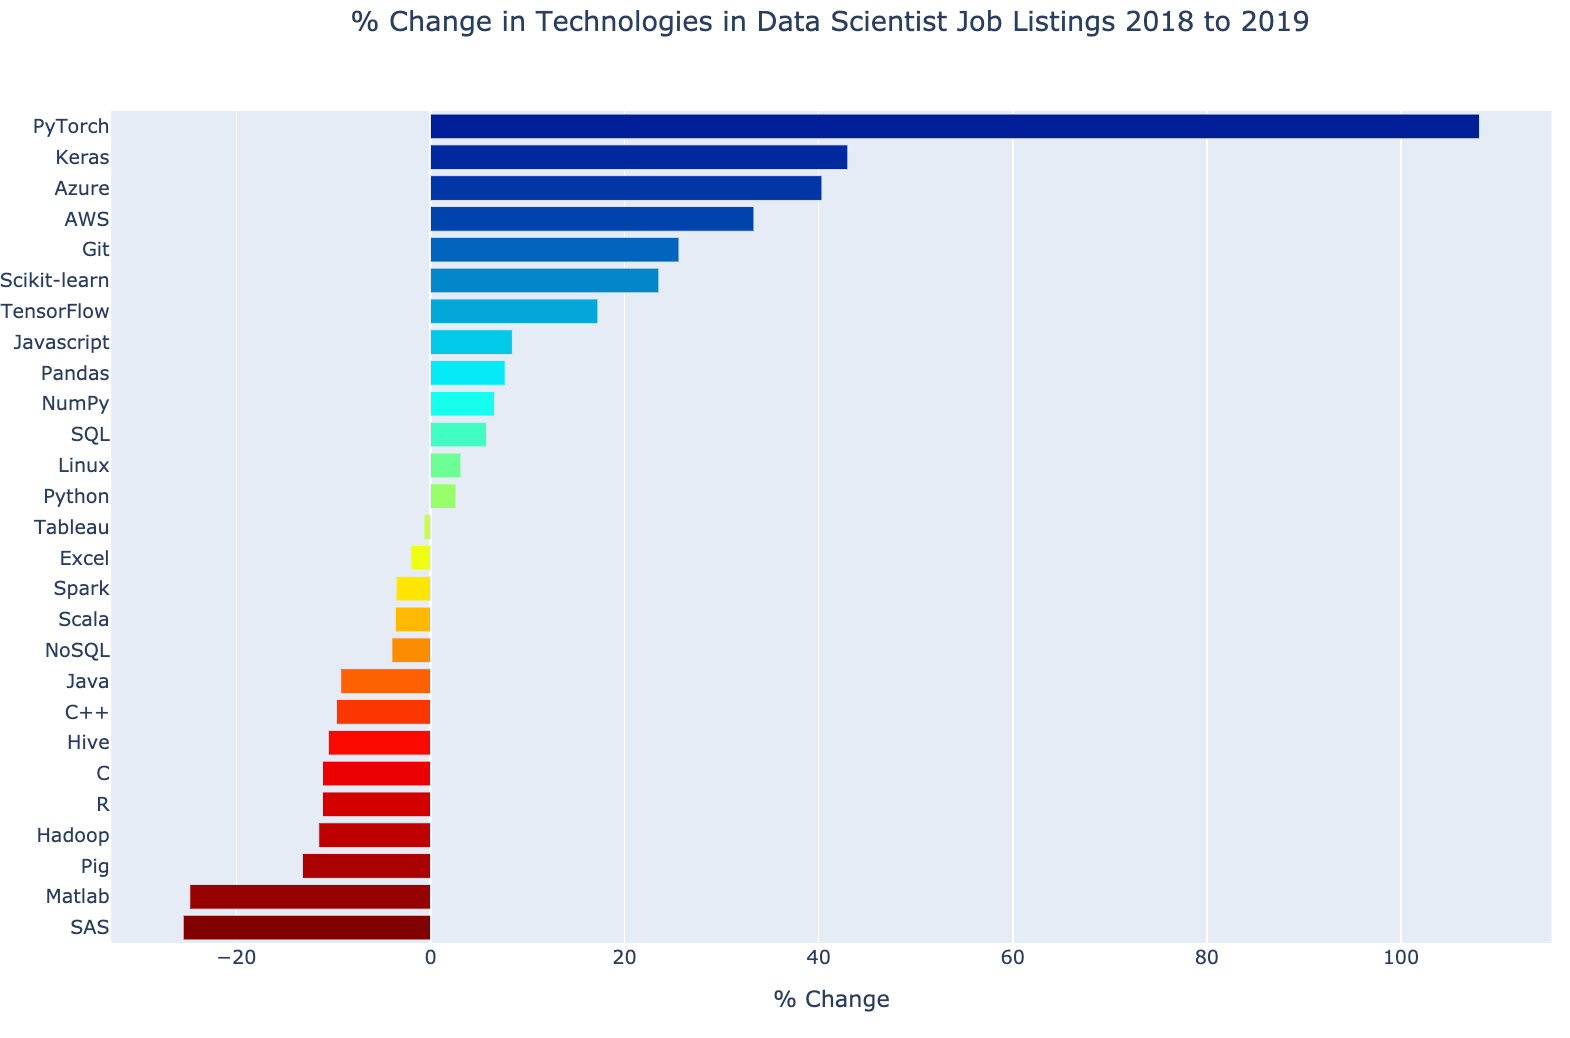
Here’s the chart for number 3 above, showing the percentage change year over year. PyTorch had 108.1% growth compared to the average percentage of listings it appeared in for 2018.
The charts were all made with Plotly. If you want to learn how to use Plotly to make interactive visualizations, check out my guide. If you want to see the interactive charts, check out the HTML file in my GitHub repo. The Juptyer Notebook for scraping, analysis, and visualizations is there, too.
Below is the information in the charts above, only in table format, sorted by the percentage change in the average percentage of listings from 2018 to 2019.
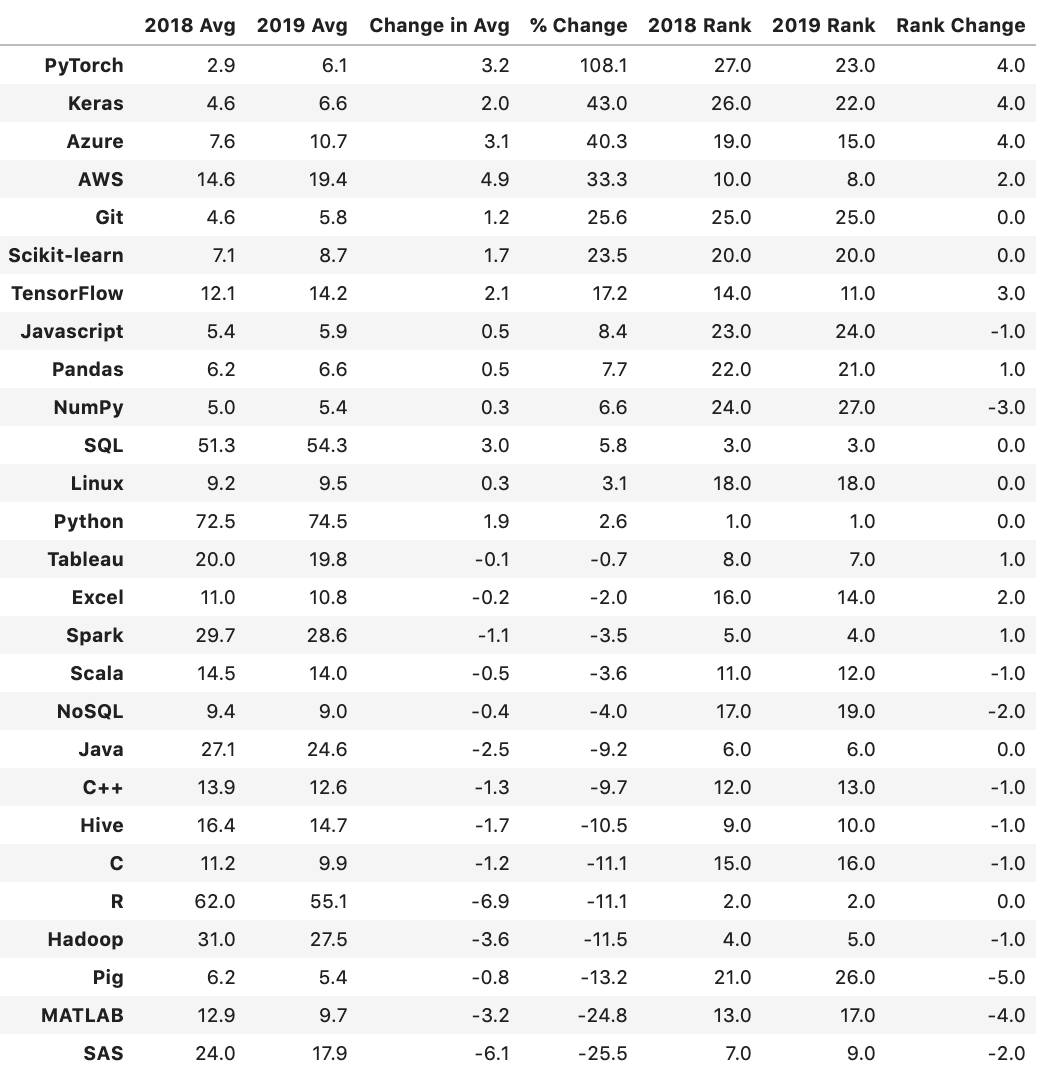
I know these different measures can get confusing, so here’s a guide to what you’re looking at in the chart above.
- 2018 Avg is the percentage of listings from October 10, 2018 averaged across SimplyHired, Indeed, and Monster.
- 2019 Avg is the same as 2018 Avg, except it’s for December 4, 2019. This data is shown in the first of the three charts above.
- Change in Avg is the 2019 column minus the 2018 column. It’s shown in the second of the three charts above.
- % Change is the percentage change from 2018 to 2019. It’s shown in the last of the three charts above.
- 2018 Rank is the rank relative to other keywords for2018.
- 2019 Rank is the rank relative to other keywords for 2019.
- Rank Change is the rise or fall in the rank from 2019 to 2018.
Take Aways
There were some pretty substantial changes in less than 14 months!
The Winners
Python is still on top. It’s by far the most frequent keyword. It’s in nearly three out of four listings. Python saw a decent increase from 2018.
SQL is ascendent. It almost passed R for the second highest average score. If trends continue, it will be number two very soon.

The most prominent deep learning frameworks grew in popularity. PyTorch had the largest percentage increase of any keyword. Keras and TensorFlow posted large gains, too. Both Keras and PyTorch moved up four spots in the rankings and TensorFlow moved up three spots. Note that PyTorch was starting from a low average — TensorFlow’s average is still twice as high as PyTorch’s.


Cloud platform skills are becoming more in demand for data scientists. AWS showed up in nearly 20% of listings and Azure showed up in about 10%. Azure jumped four spots in the rankings.


Those are the technologies that are most on the move! ????
The Losers
R had the largest overall average decline. This finding isn’t surprising given the findings from other surveys. Python has pretty clearly overtaken R as the language of choice for data science. Nonetheless, R remains very popular, showing up in about 55% of listings. If you know R, don’t despair, but think about learning Python too, if you want a more in-demand skill.
Many Apache products fell in popularity, including Pig, Hive, Hadoop, and Spark. Pig fell five spots in the rankings, more than any other technology. Spark and Hadoop are still commonly desired skills, but my findings show a trend away from them and toward other big-data technologies.
Proprietary statistical software packages MATLAB and SAS saw dramatic declines. MATLAB dropped four spots in the rankings and SAS dropped from the sixth to eighth most common. Both languages saw large percentage declines compared to their 2018 averages.
Advice
There are a lot of technologies on this list. ???? You certainly don’t need to know them all. The mythical data scientist is called a unicorn for a reason. ????

I suggest that if you are starting out in data science, you concentrate on the technologies that are in demand and growing.
Focus on learning one.
Technology.
At.
A.
Time.
(That’s very good advice, even though I haven’t always followed it. ????)
Here’s my recommended learning path, in order:

- Learn Python for general programming. See my book, Memorable Python, to learn the basics.

- Learn pandas for data manipulation. I believe an organization hiring for a data scientist role with Python will expect applicants to know the pandas and Scikit-learn libraries. Scikit-learn showed up on the list and Pandas just missed making the cutoff. You’ll learn some visualization with Matplotlib and some NumPy at the same time you learn pandas. I’m finishing up a book on pandas. Subscribe to my mailing list to make sure you don’t miss it.

- Learn machine learning with the Scikit-learn library. I recommend the book Introduction to Machine Leaning with Python by Müller & Guido.
- Learn SQL for querying relational databases efficiently. I’m finishing up a book on SQL, too. Subscribe to my mailing list to make sure you don’t miss it.
- Learn Tableau for data visualization. It’s probably the technology on the list that is the most fun to learn and the quickest to pick up. ???? Check out my Medium article for a six minute introduction to the basics here.

- Get comfortable with a cloud platform. AWS is a good choice due to its marketshare. Microsoft Azure is a solid second. Even though it’s less popular, I’m partial to Google Cloud because I like its UX and machine learning focus. If you want to become familiar with Google Cloud’s data ingestion, transformation, and storage options, see my article on becoming a Google Cloud Certified Professional Data Engineer.
- Learn a deep learning framework. TensorFlow is most in demand. Chollet’s book Deep Learning with Python is a great resource for learning Keras and deep learning principles. Keras is now tightly integrated with TensorFlow, so it’s a good place to start. PyTorch is growing rapidly, too. For more on the popularity of different deep learning frameworks, check out my analysis here.
That’s my general learning path advice. Tailor it to fit your needs or ignore it and do what you want! ????
Wrap
I hope you found this guide to the most in demand technologies for data scientists useful. If you did, please share it on your favorite social media so other folks can find it, too. ????
I write about Python, Docker, data science, and other tech topics. If any of that’s of interest to you, follow me and read more here.
Happy Learning! ????????
Bio: Jeff Hale is a Data Scientist, author of Memorable Python ???? & Memorable Docker ???? and an Ecommerce COO.
Original. Reposted with permission.
Related:
- The Most in Demand Skills for Data Scientists
- Which Deep Learning Framework is Growing Fastest?
- Which Data Science Skills are core and which are hot/emerging ones?