Take Advantage Of Professional CTO Dashboards & Reports
A chief technology officer (also referred to as chief technical officer or chief technologist), has an immense responsibility to drive an organization forward and lead the technological advancements, research, development, and management in order to generate business value and increase the return on investment (ROI).
To successfully gain control and improve a company's technological needs, CTO dashboards and reports are needed as invaluable tools that consolidate multiple data points and support technology officers in strategic developments as well as online data analysis efforts, empowering their status of champions for new solutions. A crucial position within the c-suite of a company as the highest technology executive position, CTOs need to align technology-related decisions with the company's goals. Oftentimes, this task is not easy but mixed with both business and technical or IT challenges that require the usage of modern CTO reporting software and tools.
To put things into perspective, we will focus on CTO dashboards and reports, beginning with the definitions, continuing with examples that you can use for your own business requirements, and finishing with the most prominent benefits these dashboards and reports deliver. Without further ado, let's begin.
Try our professional dashboard software for 14 days, completely free!
What Is A CTO Dashboard?
A CTO dashboard is a visual tool that assists in monitoring and analyzing crucial high-level IT metrics such as support expenses or critical bugs. These interactive tools allow CTOs and other IT executives to get a centralized and dynamic view of all relevant IT data.
Moreover, such dashboards offer succinct visuals that are easily accessible and shareable with the rest of the c-level management while making the data management processes more digestible and polished for everyone involved. In its very essence, an IT leadership dashboard is extremely customizable, making it accessible in any technology and non-technology-based industry where CTOs have importance such as game development, biotechnology, automotive, etc.
That said, these dashboards can also be used as CTO reports.
What Is A CTO Report?
A CTO report is based on a curated collection of data and statistics that exist within the dashboard and offer a wealth of information based on established KPIs that can be easily automated and shared across the board, in order to monitor relevant IT performance.
CTO reporting delivers a presentational focus on relevant data that CTOs need to collect to be able to generate actionable insights and improve the company's technological bottom line. Duties such as managing the IT infrastructure, planning technical strategies, analyzing target markets, and creating business models need proper management reporting tools that CTOs can utilize and derive short and long-term value for an organization.
By facilitating visual metrics and mixing interactive features, these reports ensure advantages in operational and strategic developments within the organization such as automation. Consequently, time is generously saved and productivity levels easily rise but we will focus on detailed benefits later in our article. Now we will present a comprehensive CTO dashboard example that will put our notions into a visual perspective and explain how simplicity and complexity work together on a single screen.
Benefits Of CTO Dashboards & Reports
We’ve already covered the definition of these two analytical tools. Now, it is time to look at the benefits they can bring to the daily workflow of a chief technology officer and their team. Dashboards and interactive reports facilitate the way businesses deal with important data, they allow for quick access to relevant insights that can significantly enhance the decision-making process. Let’s see some key benefits more in detail.
- Centralized view of data: As mentioned above, technology officers deal with various areas of the business such as marketing, product, finances, and IT. This means they need to consider data from several sources in order to make the best decisions for the organization. Modern CTO dashboards provide a centralized view of the most important KPIs all on one screen. This level of interactivity allows users to navigate the data with the help of intuitive filters and find the answers to any questions that might arise on the go.
- Improve communication: According to a survey conducted by STX next, 39.9% of CTOs have between 1 to 5 people reporting to them. Followed by 32% that have up to 10. Taking that into account, it is no secret that CTOs have their plates full. Keeping track of the performance of every employee working in different areas it’s hard and time-consuming. Modern dashboards facilitate the task by providing multiple sharing options that allow every relevant stakeholder to stay connected and collaborative.
- Enhanced issues management: Staying on top of any issues is another important task that CTOs need to ensure. Modern dashboards provide the accessibility needed to stay on top of any problems. With technologies such as intelligent data alerts powered by AI, CTOs can be immediately notified as soon as any issues arise in the data. This will allow for efficient risk management as well as the chance to find improvement opportunities that might otherwise remain untapped.
- 24/7 online reporting access: Expanding on the point above, dashboards provide 24/7 access to relevant data. The only thing you need to access them is an internet connection. This allows CTOs to access their latest information from wherever they are, making their data management process way more efficient. Having 24/7 access to real-time information also allows for the efficient functioning of daily business operations.
Professional CTO Dashboard Examples
When we spoke about gathering all relevant data points under a single umbrella, a CTO dashboard tool offers a robust solution that will form the very foundation of your tech-based decisions, and here we explain exactly how with the help of our two visual examples.
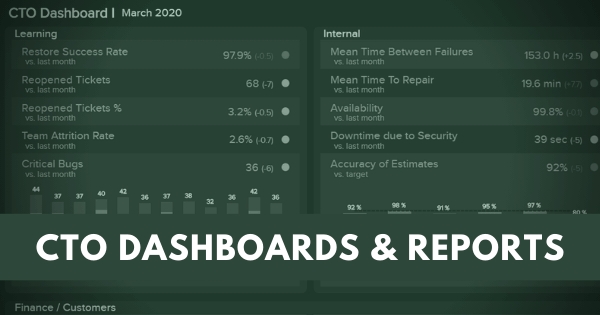
1. CTO Dashboard Template
**click to enlarge**
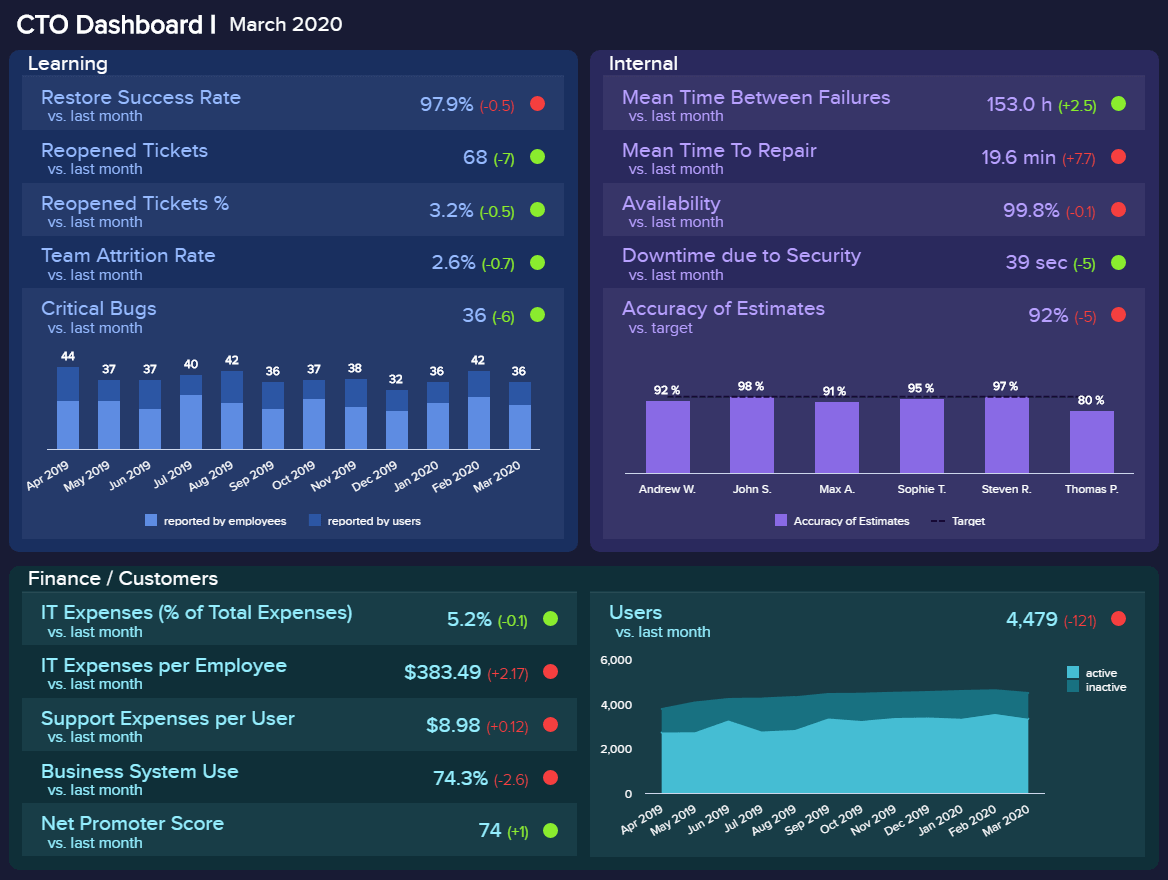
The CTO report example depicted above was created for a monthly overview but incorporates a quick comparison to the previous month, in this case, February. We can see 4 main pillars of higher-level metrics that focus on learning, internal processes, finance and customers, and, finally, users.
The learning aspect covers critical metrics such as reopened tickets, team attrition rate, and critical bugs, compared to the last month as well as visually represented over through the course of a year. This CTO reporting structure enables chief officers to quickly identify main bottlenecks within the ability of the department or company to effectively learn from errors and avoid potential lags within the IT operation.
Secondly, the internal pillar with the meantime to repair, availability, downtime due to security, and accuracy of estimates will help teams to prevent and plan better the measures needed to optimize and improve their performance. For instance, we can see that Thomas hasn't delivered a satisfactory level of accuracy so it would make sense to start asking questions in order to avoid such scenarios in the future.
Thirdly, each CTO dashboard software needs to enable users to easily track financial and customer-related data. In our template, the data story focuses on IT expenses in the percentage of total expenses, per employee, per customer as well as net promoter score and business system use. We can immediately spot some issues which are triggered automatically by the IT dashboard and set them in red color to attract immediate attention. The chief officer has a clear signal that finances need more focus and monitoring in order to avoid potential issues.
Finally, a clear overview of active and inactive users can give you a quick glance into the performance of this month but also the development over time, in this case, a year. All these features will enable you to immediately spot inefficiencies within your scope of work and ensure your strategic initiatives are followed by effective operational management and efforts. That way, with the help of modern IT analytics, you can deliver true business value and outstanding performance.
Primary KPIs:
- Number of Critical Bugs
- Re-opened Tickets
- Accuracy of Estimates
Try our professional dashboard software for 14 days, completely free!
2. Cyber Security CTO Report Template

**click to enlarge**
Our first example provided a general overview of all areas a CTO needs to manage. The second example puts more attention on the internal pillar, specifically in the cybersecurity strategy. With data breaches becoming more common, the need for a strong cyber security strategy becomes critical. That said, according to the CTO survey 2021 from STX Next, a surprising 42% of CTOs say their companies have no cyber security at all. Therefore the need for an analytical tool like the one shown above becomes critical.
Going into the dashboard, we first get insights into the intrusion attempts which are divided by week and type of attack. This is a useful overview as it can tell the CTO and CIO how frequently the business is being targeted and what are the most common threats to find preventive measures. This information is complemented by the backup frequency as well as a cyber security rating. This rating is previously defined by criteria imposed by the organization and it should always be as high as possible.
Next, we get an overview of the meantime to detect and the meantime to resolve. As their name suggests, these two CTO performance metrics indicate the time it takes for the IT department to detect and attack and then resolve it. Naturally, the meantime to detect should always be as low as possible, as the longer it takes them to detect an attack the more damage the attacker can do to the system. On the other side, the time to resolve will also depend on the type of attack as some of them are harder to solve.
Finally, the dashboard displays a chart tracking the success rate of phishing tests. These tests basically measure how likely are your employees to fall for phishing attacks such as emails with suspicious links. Getting insights into this can allow you to find weak spots and implement training opportunities to avoid employees falling for any attacks. In the end, these phishing tests prove to be very useful, especially considering that human error is accounted as the biggest cybersecurity threat by the respondents of the CTO report that we mentioned above.
Primary KPIs:
- Cyber security rating
- Amount of intrusion times
- Meantime to detect
- Meantime to resolve
- Backup frequency
- Phishing test success rate
How To Create A CTO Dashboard & Report?
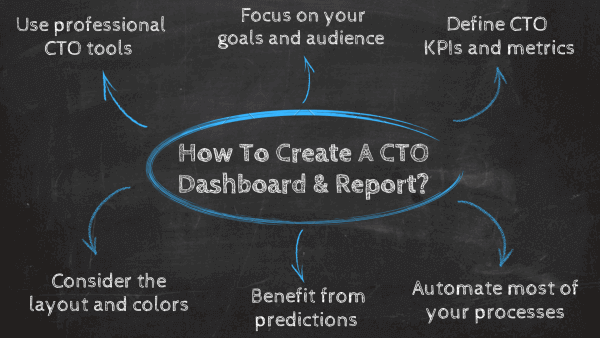
Now that you've seen the invaluable opportunity that comes along with automation, dynamic visuals, and all the features and benefits of modern CTO reporting software, here we will present some basic tips on how to create such dashboards and what to keep in mind during the process.
1. Use professional CTO tools and software
When you want to extract value from CTO tools, it's critical that choosing the right software is on top of your mind. Especially in the technology area, chief officers have the challenging task of managing the whole tech cycle of an organization, including optimization and future developments. Professional tools that enable you to create customizable metrics such as financial charts and incorporate them into an interactive visualization will certainly help you to comprehend your CTO data collection and management seamlessly.
2. Focus on the goal and audience
Another critical point to consider is the end goal. Chief officers need to be on top of various tech-related data and, no matter if they're building the dashboard on their own or have a team member to do it, it's important to focus on the most valuable metrics and general audience. The report for the team meeting and operational activities will have different metrics than the one designated for the CEO or board meeting. Also, don't forget to prepare yourself!
3. Define CTO KPIs and metrics
Once you have defined the general goals and needs of your business it is time to choose the right CTO KPIs and metrics that will help you measure the progress and success of your activities. Just like with any other business area and function, the CTO metrics you measure will depend on the size of the company as well as the industry. What might work for some organizations, might not work for others. Therefore, it is important to take the time to assess which key performance indicators will help you the best. If you want to get all the necessary information to choose the best performance indicators for your business take a look at our guide on KPIs vs metrics.
4. Consider the layout and colors
While it may be intuitive to put as much information as possible onto a single digital dashboard, the point is to build a narrative and expand on certain processes and issues. Using a simple layout and respecting your company's colors might seem easy but sometimes it creates a challenge. As mentioned, no matter who builds the dashboard, the important part to remember is to define a layout and colors that will not overburden the dashboard and create clutter.
5. Benefit from predictions
In addition to fixing IT-related issues, a Chief Technology Officer needs to develop, implement, and manage the technological resources of an organization. In order to do so, they need to support themselves with data-driven technologies that will help them make the best-informed decisions. Predictive analytics and AI-powered technologies allow CTOs to generate accurate predictions about users' behaviors by analyzing current and historical data to find trends and patterns. This way, they can identify actions that are most likely to lead to a conversion and incorporate strategies to increase profitability and provide an excellent service.
6. Automate most of your processes
One of the main benefits of using a CTO report tool is the opportunity to schedule and automate dashboards as well as weekly or monthly reports. On an operational level, it might make sense to schedule them weekly but on a strategic, you will need a longer time frame. No matter the scenario, the possibility to schedule and deliver the dashboard updated in real-time, without the need for any manual activity, is a critical factor when you consider creating a weekly dashboard, monthly, quarterly, or all of them together.
To learn everything about the bits and pieces of this comprehensive topic, we suggest you read our guide on how to create a dashboard.
Try our professional dashboard software for 14 days, completely free!
Let's Conclude!
Being a CTO is, by all means, no walk in the park but challenging and, at the same time, a rewarding field that offers deep insights into the technological advancements and management of an organization.
We have explained the definition of a chief technology officer dashboard and report, offered a real-world example, and showed you some tips to follow in order to become more effective in dashboard and reporting creation. Now it's your turn to take this reading into a real scenario and start creating your own chief technical officer dashboard with datapine, and use our 14-day trial we offer completely free!