

Predicting COVID-19 on the U.S. County Level
As a majority of counties have already detected COVID-19 cases, today (4/1/2020) is our last update. Our data science team is switching to other projects related to COVID-19.
With the fight against COVID-19 spreading across the U.S. and the world, DataRobot understands it is essential that federal government entities convey accurate information to citizens, local governments, and healthcare providers. Towards that end, the DataRobot AI Platform has developed models to predict which U.S. counties are likely to have their first confirmed COVID-19 cases in the next five days.
It is our hope that the federal, state, and local governments can use this information to budget resources, take preemptive measures, and help citizens to take preventive measures. This information also would be very useful to healthcare providers to help prepare their staff with the most accurate information.
[UPDATE] We are releasing new U.S. country predictions based on the data available today (4/1/2020).
| IL Boone County | IL Vermilion County | AL Dale County |
| NC Pender County | MD Allegany County | ID Latah County |
| NM Los Alamos County | MO Phelps County | AR Miller County |
| OH Scioto County | NM Otero County | VA Caroline County |
| AL Coffee County | CA Tehama County | OR Coos County |
| WI Manitowoc County | IL Coles County | VA Falls Church city |
| NC Haywood County | SC Cherokee County |
[UPDATE] We are releasing new U.S. county predictions based on the data available today (03/25/2020):
| MO Platte | SD Lincoln | VA Roanoke |
| KS Shawnee | TX Jefferson | ND Grand Forks |
| TX Randall | OK Rogers | TX Rockwall |
| AZ Mohave | GA Jackson | CA. Kings |
| VA Montgomery | VA Fauquier | ID Bonneville |
| RI Kent | IL Tazewell | MO Cape Girardeau |
| TX Guadalupe | IN Kosciusko |
[UPDATE] We are releasing new U.S. county predictions based on the data available today (03/23/2020):
| VA Chesapeake | MS Alcorn | OK Rogers |
| IN Porter | KS Shawnee | IL Macon |
| MS Lauderdale | VA Hampton | KY Campbell |
| TN Madison | FL Gilchrist | MI Van Buren |
| MS Warren | AL Morgan | WV Berkeley |
| AZ Mohave | SC Laurens | MN Otter Tail |
| SC Oconee | AL Marshall |
[UPDATE] We are releasing new U.S. county predictions based on the data available today (03/20/2020):
| NJ Ocean | CT New London | MS Rankin |
| KS Sedgwick | IA Linn | OH Portage |
| CA Butte | FL Bay | FL Flagler |
| PA Dauphin | CA Merced | IN Porter |
| MI Kalamazoo | NH Strafford | MD St. Mary’s |
| CA El Dorado | FL St. Lucie | |
| AR Benton | VA Chesapeake |
[UPDATE] 17 of our top 20 predictions from yesterday have already been confirmed. We are releasing new U.S. county predictions based on the data available today (03/18/2020) :
| OH Hamilton | IN Allen | NC New Hanover |
| WA Benton | VA Albemarle | NC Union |
| MO St. Charles | CA El Dorado | FL Leon |
| PA Berks | AR Benton | FL Marion |
| OH Montgomery | KS Sedgwick | MI Kalamazoo |
| NE Lancaster | PA Dauphin | FL St. Lucie |
| OH Warren | CA Butte |
Based on model trained with data from March 16, 2020, the top 20 risky counties are:
| UT Utah County | NC Guilford | FL Brevard |
| OH Hamilton | FL Polk | CA Monterey |
| TX Williamson | OH Delaware | NC Orange |
| IL Will | WA Benton | OR Lane |
| VA Henrico | MO Jackson | FL Leon |
| AL Madison | MO St. Charles | |
| CA Kern | SC Richland |
This map shows the 449 counties that are currently infected in dark blue and the predicted 50 high risk counties in light blue.
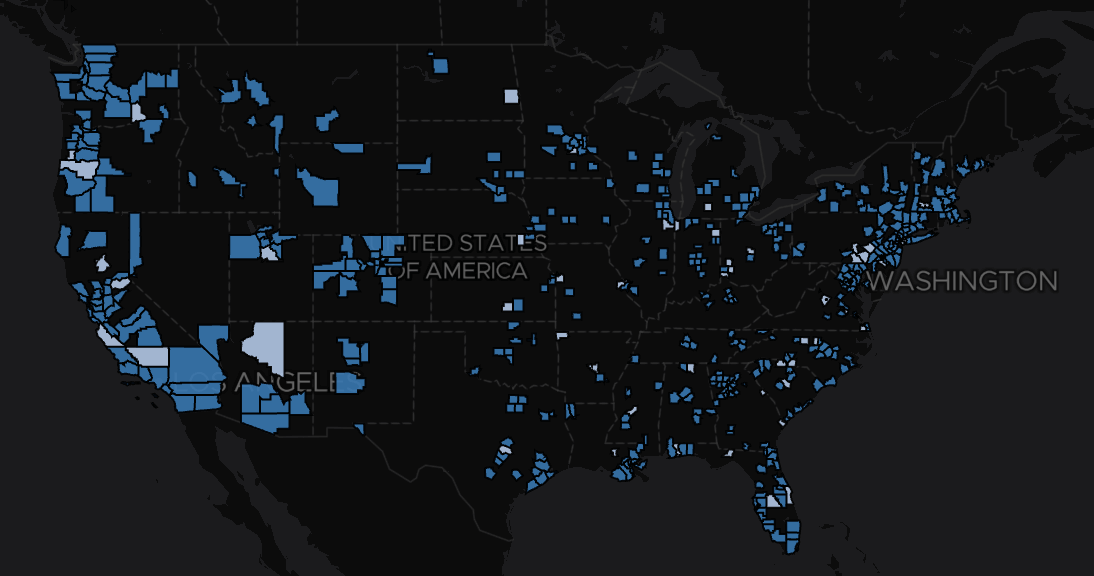
Our models suggest that regions with larger populations, higher median income, and a higher level of education are more susceptible to infections in the early outbreak of the coronavirus. Factors leading to this conclusion may include that this is a population that has been travelling more and is also getting tested at a higher rate. Because the movement of the virus is changing every day as testing and travel patterns change, we need to update these predictions on a regular basis.
The models used to predict these results appear to be quite accurate. On March 11, 2020 we predicted 50 high-risk counties. As of March 16th, 44 of the 50 reported confirmed cases by March 16, 2020, 5pm EST.
What data did DataRobot use?
DataRobot drew from the following resources:
- Johns Hopkins University’s dataset of confirmed cases
- Existing U.S. county-level socioeconomic data
- U.S. county geo-coordinates
- News Break Coronavirus Realtime Updates

- Claritas demographics data
- County data from USAFacts
How does the DataRobot model work?
DataRobot identifies patterns in demographic and socio-economic data in counties that have reported cases of the COVID-19 and uses those patterns to identify similar counties who have not. The models performed well, with an 88% precision rate for a five-day forecast of its top 50 predictions. Precision increases to 96% with a 10-day forecast window.
Next Steps
The county-level Johns Hopkins data that DataRobot used for this model is now being aggregated at the state level, so it is no longer useful for our model. The value of each model decreases day by day without new data. Each day that we miss out on new data represents a missed opportunity to help local officials and healthcare providers with more information.
The following data would be helpful in filling the gap:
- Alternative data sources that are tracking infection rates on the county level.
- More county-level data, such as road density, airports, hospital beds, age distribution, and population density, as well as data on travel between counties and airports.
Collection of this data will allow DataRobot’s data scientists to generate manual geospatial features, allowing them to make predictions on which counties in the U.S. have a higher probability of infection.
Even with county-level data, DataRobot can model the spread of the disease, but not the severity of outbreaks or location of the next hot spot. If those leading the response in hot spots like Washington state, New York, and elsewhere can provide more localized disease and infection information, as well as socio-economic data, than what is currently available, we can model the severity of outbreaks and locations of the next hot spots.
If you have questions or would like more information, please email COVID19Responseteam@datarobot.com

Sergey is a data scientist and Director of Advanced Data Science Services at DataRobot where he leads data science execution group.

Chen is Director of Partner Data Science at DataRobot, where he drives product integration, demand generation and customer adoption through tech alliance and channel service partner ecosystem. He leads joint partner AI solutions to facilitate value creation for customers. Prior to DataRobot, Chen was at IBM leading internal AI projects.

Monisha is an Execution Data Scientist in DataRobot. Yuvaraj develops end-to-end enterprise AI solutions with DataRobot Enterprise AI Platform for customers across industry verticals.
-
How to Choose the Right LLM for Your Use Case
April 18, 2024· 7 min read -
Belong @ DataRobot: Celebrating 2024 Women’s History Month with DataRobot AI Legends
March 28, 2024· 6 min read -
Choosing the Right Vector Embedding Model for Your Generative AI Use Case
March 7, 2024· 8 min read
Latest posts
