


As data scientists, we work on solving various business problems to make predictions on a given population where there isn’t a very easy (and cost effective) way of knowing if you have a true representative training set for the unlabeled population. For this blog, I am trying to predict the census tracts in the U.S. that will have above average counts of people who suffer from diabetes based on their social determinants of health.
We can collect the training data from various surveys conducted by the U.S. census/Centers for Disease Control and Prevention in major regions, but those regions can highly differ in demographics from most small census regions of the U.S. The data science challenge that this creates is that the distribution of variables in the data from major regions will be significantly different from the small regions.
How do I resample my training set so that the data distribution matches the distribution of the population to be scored?
I propose to use quite an old technique called propensity score matching to create an unbiased training set. In one of my past machine learning projects for a similar business problem, our predictions looked off and we ruled out overfitting as the cause of poor model results. We soon realized the reason for poor model performance was that the distribution of the data we were scoring the model with was different from the distribution of the train set — which is what we call covariate shift or data drift. We decided to focus on finding ways to mitigate covariate shift and ensure our train set distribution matched the distribution of the data we were scoring with the model.
Background
The training set will be built using the BRFSS 500 major cities dataset that provides information on the count of people with diabetes by census tract. Another dataset I used is U.S. census data to get the social determinants of health (i.e: race, income, education, age, employment, etc.) by census tracts available in a Google BigQuery public dataset.
We aimed to create a training set such that it matches the distribution of the prediction set to get more robust results. The reason for this is the 500 major cities dataset is only from the major cities in the U.S. The problem is that if we will build a model on major cities as-is and use it to predict diabetes prevalence in the entire U.S., we might get inaccurate predictions. For example, predicted diabetes prevalence most likely will be inaccurate in a small area like Danville, Va. with a model trained on data from New York City. But if we can oversample the data points from certain sections of New York City (for instance, some census tract in the Bronx) that have demographic features like Danville, then we are likely to have better predictions.
Data Preparation
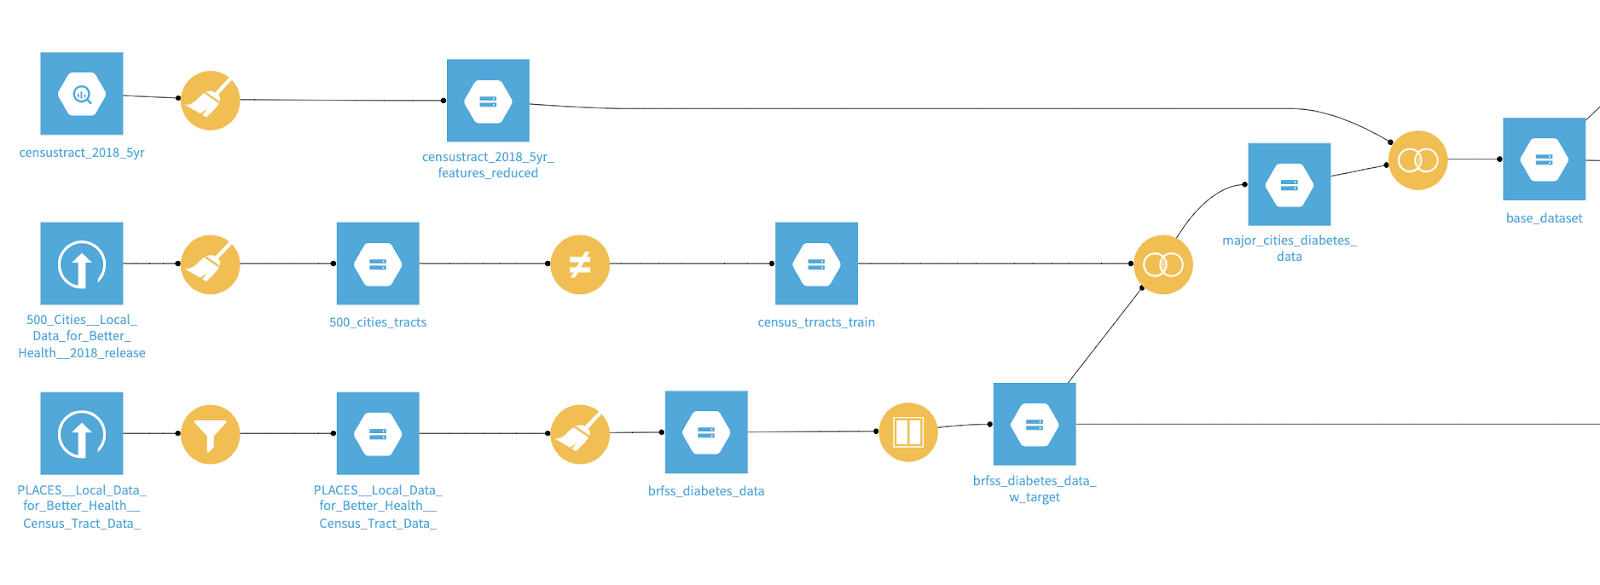
I joined the census data with BRFSS data to get a single dataset for building our model. I also created two new variables:
- Target_propensity: Flag to identify which census tracts are in the training set vs. which are in the prediction set
- Target_Diabetes: Flag to indicate which census tracts in the training dataset have greater than average prevalence of diabetes than the U.S.
Next, we prepared the training set and prediction set by looking at the census tracts where Target_Diabetes was not available.
Propensity Matching Approach
Here are the steps we took to apply the propensity matching technique:
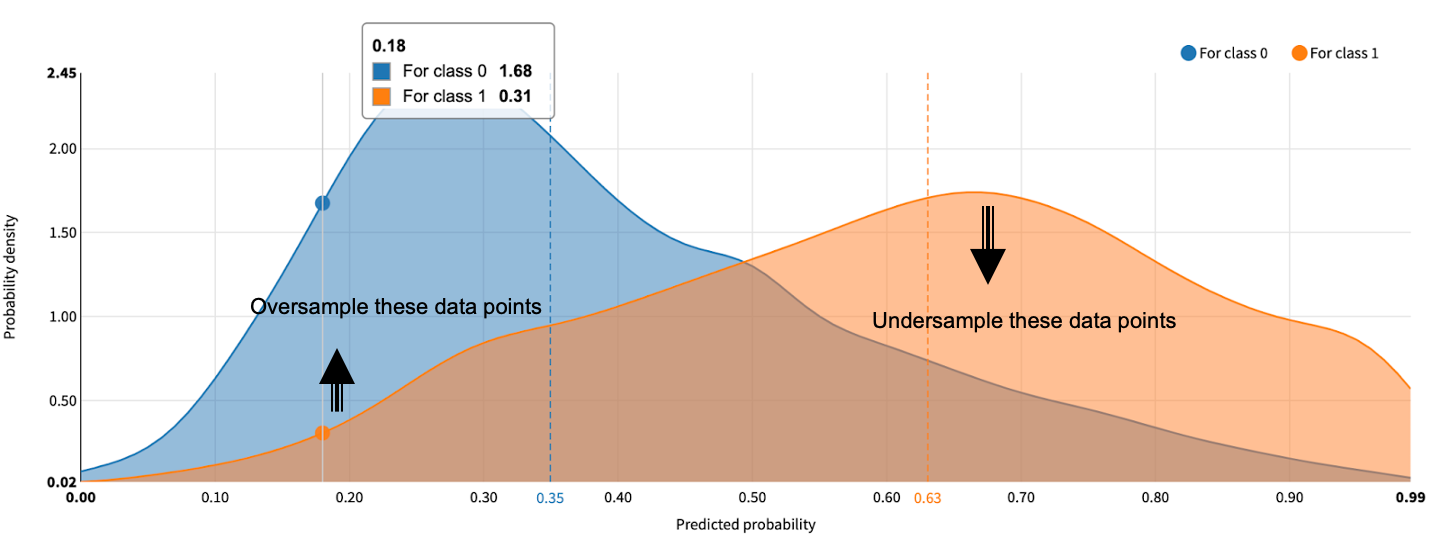
1. After preparing the train set and predict set, we created a simple logistic regression model with Target_propensity as the target variable [Target_propensity = 1 for the training set].
The purpose of performing logistic regression is to check if the covariates are balanced across training and unlabeled data within ranges of the propensity score. So, if the distribution shown here was overlapping, then you have a good training set to start with.
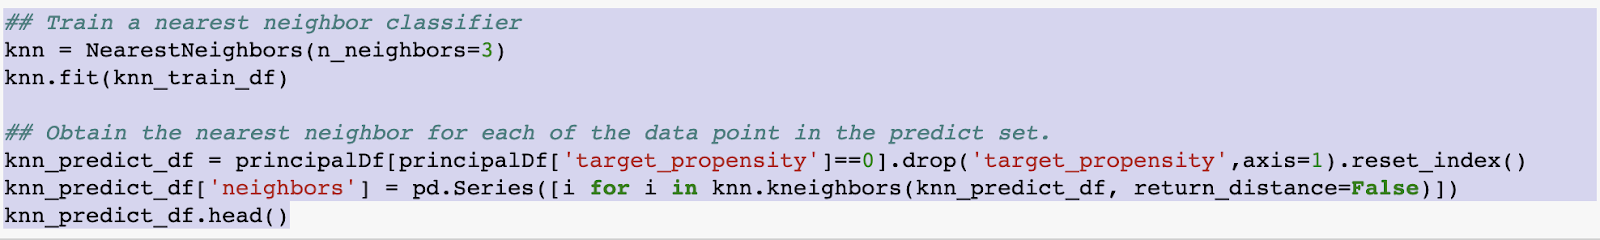
2. The next step was to use the output of this model to iterate through each record in the predicted set and find the nearest neighbor for the tract in the dataset where diabetes prevalence is available. I have provided the code snippet below but we can also use Dataiku’s similarity search plugin to find nearest neighbors without coding.
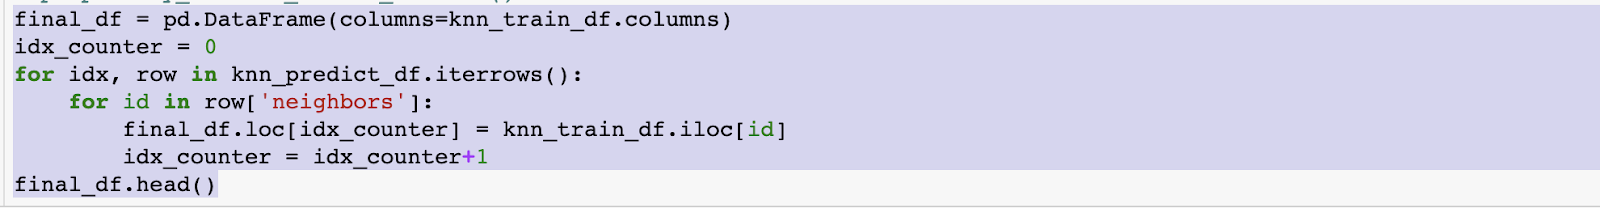
3. Then, I collected all the nearest neighbors and stored them in a final training dataset. That way, I got all the nearest neighbors from the train set for the record in an unlabeled dataset and then can append the nearest neighbors to the train set to oversample the train set.
What Are the Next Steps?
The new training set obtained in the step above will be used for training our final model. You can also standardize your own twist to this propensity scoring approach of creating an unbiased training set and convert it into a plugin for your organization. I hope that this post has motivated you to think about how the distribution of your training dataset aligns with the population you are trying to score. In a future article, we will review how these adjustments affect our predictions. We will also explore if using this approach gave us any statistically significant gains. Interested in learning more on this topic? You can check out this blog post that explains how to explore model biases using Dataiku features.