Kaggle Grandmaster Series – Exclusive Interview with Andrey Lukyanenko (Notebooks and Discussions Grandmaster)
Introduction
“In case you are only starting your journey, I suggest to read some great notebooks to understand what is interesting to people, then start small”- Andrey Lukyanenko
We know many people in the data science community who start really big on Kaggle and give on it without exploring alternative approaches to start their Kaggle Journey thinking it is not meant for everyone.
Another day, another bubble to burst. We are back with the sixth interview in this Kaggle Grandmaster Series and this time we have Andrey Lukyanenko with us.

Andrey is a Kaggle Notebooks as well as Discussions Grandmaster with ranks 3 and 10 respectively. He has 40 Gold medals for his Notebooks and 10 for his Discussions. His notebooks are amongst the most accessed ones by the beginners. He is also an Expert in Kaggle’s dataset category and a Master in Kaggle Competitions.
Andrey is an economist by education and started his career as an ERP-System consultant before shifting into data science. He brings his expertise across both domains and explains how we can amalgamate them to avert an economic crisis.
In this interview, we cover a range of topics, including:
- Andrey Lukyanenko’s Education and Work
- Andrey’s Kaggle Journey from Scratch to becoming a Kaggle Grandmaster
- Andrey’s advice to beginners in Data Science
So without any further ado, let’s begin!
Andrey Lukyanenko’s Education and Work

Analytics Vidhya (AV): You’re an economist by education. How did you enter the field of Data Science? Also, can you mention some sources that helped you in the transition?
Andrey Lukyanenko(AL): After graduating from the university I have worked for several years as an ERP-system consultant. In that part of my career, I didn’t know programming and was an analyst, solving various problems related to ERP-systems. During that time I took part in multiple projects ranging from logistics to accounting. My background in Economics helped me to understand business needs easier.
After several years of working as an ERP system consultant, I decided to switch my career to Data Science. I left my job and started studying programming, statistics, machine learning, and other things and it took me nearly 8 months to get the first job as a DS.
My first book on programming was “Automate the Boring Stuff with Python“ and it helped me to start writing python code. After that, I used KhanAcademy to brush up on math and statistics. And the famous course on machine learning by Andrew NG was my first real step in my data science journey.
Since 2017 I have worked in several companies on many data science projects and also made pet-projects, took part in Kaggle, gave talks at conferences, and had other activities.
I have written a blog post with a Data Science roadmap, it covers some of the useful resources.
AV: Can you give a brief idea about how data science is used by an economist in general?
AL: First of all I want to say that a lot of economists already use data science tools and approaches, even if they have different names. For example, it is known that classical machine learning (like linear regression) is redesigned statistics. Data Visualization and Data Analysis are also a part of data economists’ job. On the other hand, Data Science is more about predictions than causality, so it is more relevant when working with Big Data.
Model interpretability is important when you have to explain predictions of more complex models (like gradient boosting), so economists, who are well versed in the topic of causality, could use tools like ELI5 or SHAP.
AV: As an economist and a data scientist, how would you use data science to deal with the economic crisis the world is facing because of the coronavirus pandemic?
AL: I think Data Analytics could be the most important part of Data Science to help to deal with the economic crisis.
Companies could use analytics to identify their advantages and disadvantages and then work on them. Processes automatization could also be a part of Data Science. Governments could analyze the macro-and micro-economics datasets to find groups of people, who would need help.
Still, as you can see, data science can provide data and insights but this is up to people to act based on this information. If we talk about Data Science more broadly, then ds/ml tools could be used to improve existing products or create new ones.
AV: Can you explain your latest involvement in Medical Chatbots and how they’re leveraging ML/DL?
AL: Currently, I’m working in MTS AI as a TechLead of NLP part of medical chat-bot. We aim to help people find doctors who could help them with their health problems.
In general, there are a lot of different medical chat-bots and many ways to use ML/DL models.
One of the main purposes is the immediate response. Often getting an appointment with the doctor, waiting for it could take really a lot of time, but chat-bots can always answer the questions. For example, medical companies could use common chat-bots to help people set appointments or get answers to general questions.
Some medical chat-bots simply provide access to a certain database or a knowledge graph and answer questions about drugs, symptoms, and other predefined topics.
More complex chat-bots could use ML to extract detailed structured information from the user’s request (for example models for Named Entity Recognition) and show possible diagnoses.
Some chat-bots may use generative models to converse with users, but this approach could be dangerous because generative models can give unexpected results.
Another example of a medical chat-bot could be a personal assistant reminding about medications, doctor appointments, and other things and allowing to set new information through dialogue instead of using apps.
An interesting idea is using chatbots to help people deal with mental health problems – it could listen, give advice, be a friend or someone else.
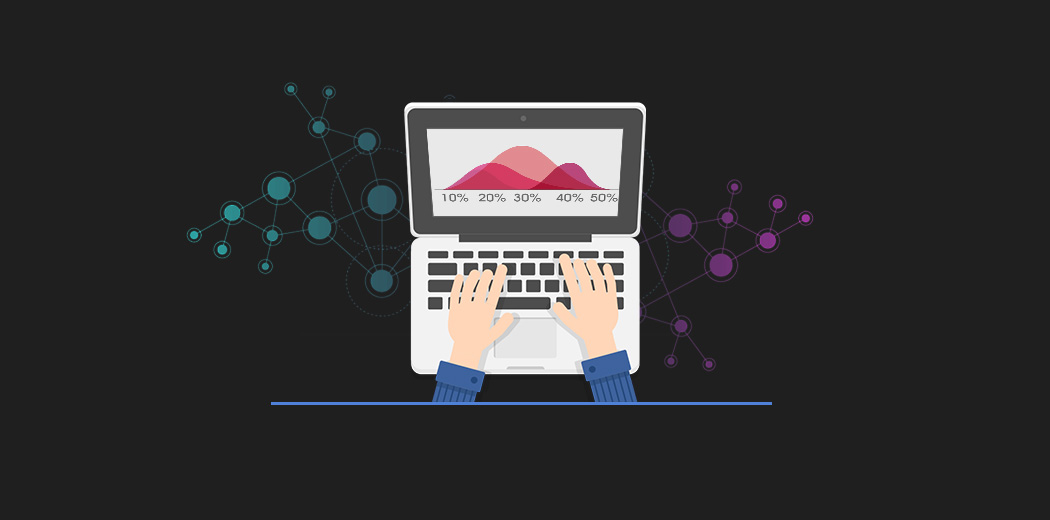
Andrey’s Kaggle Journey from Scratch
![]()
AV: Currently, you’re Kaggle Double Grandmaster- Notebook and Discussion. What were the challenges you faced in the respective journeys?
AL: As you could guess, the journeys through the rankings were completely different between notebook and discussions.
First I’ll talk about Notebooks. I think the main challenges could be broadly split into two types: technical and non-technical.
By technical I mean writing the notebook itself. When you do it for the first time, it will likely take a lot of time, you’ll make mistakes, it will be messy, and so on. But consistent and deliberate practice will help. With time you’ll get used to writing better code, you’ll be able to reuse code from your previous notebooks, you’ll know what works and what doesn’t.
One serious choice which you need to make is about what kinds of notebooks you are going to write: you could write notebooks only for certain types of competitions, for example only on tabular data, or you could decide to write notebooks for a variety of competitions. In the former case, you’ll be able to reuse more code and to delve more into this area of knowledge. In the latter case, you’ll get experience in many tasks, but it will take more time and effort to learn all the new things.
But even in the first case, you’ll have to constantly study: the machine learning field is rapidly changing, new approaches constantly emerge and if you want to succeed on kaggle, you have to stay on the top of the new things.
As for non-technical stuff – you need to learn when and how to write notebooks to get the most votes. For example, if you write a notebook for a small dataset, which is unknown, you’ll hardly get any upvotes, on the other hand, notebooks in popular competitions can accumulate hundreds of votes. At the same time, the competition for votes is sometimes quite fierce and I usually wrote my first notebooks for competition within a couple of hours from its start. This is really challenging but very fun at the same time. It makes you learn to create MVP, to be able to find your way around a new dataset and to write reusable code fast. Also, it is a good idea to promote your work on social media to find a more broad audience.
As for discussions, I think it kind of happened on its own. I answered the comments on my notebooks, shared, and discussed ideas about competitions in which I took part, and my discussion ranking steadily increased.
AV: The approach/framework that you followed while creating your first notebook vs now. What has changed and what is still the same?
AL: The most important difference is that I have more experience and I can borrow ideas and code from my previous notebooks.
The main workflow is still the same:
- At first, I carefully read the description of the competition, information about metrics, evaluation, and the data itself.
- After that, I create a notebook, load the data, and look at it to explore the basic statistics of the data.
- If I don’t have experience with the task at hand, I read the public notebooks and search articles on the internet to learn how people approach such problems.
- In case I have enough experience, I can move to the next step and start a detailed exploration of the data – I’ll talk more in the answer to the last question.
- Feature generation (if applicable) and training the model are usually the key parts of the notebook.
- There can be more things in the notebook – like model interpretation.
Nowadays thanks to my previous notebooks I can do most of the steps faster now and can focus on the quality of my notebooks or on pursuing advanced approaches and topics
AV: What are the three things that one should keep in mind if he/she wants to achieve a higher level in notebook Ranking?
AL:
- Write detailed explanations: too often I see notebooks with lots of plots, long logs of model training but lacking even the basic analysis. Nowadays it is easy to learn how to train models, but the way you are thinking, your ideas, thoughts, and approaches – this is what makes you different, unique, and interesting.
- Choose when and where you write notebooks. I have seen a lot of good or even amazing notebooks with disappointingly low numbers of votes. Usually, there are three reasons for it: as I have already mentioned some people write notebooks on less known datasets thus limiting the number of people who could see the notebook; some other people write notebooks when it is “too late” – for example, the competition is near the end or these ideas were already explored by other people, and most new people aren’t known and don’t promote their work – as a result almost no one sees their notebooks.
- Be consistent, determined, and honest. Write notebooks with a good periodicity, don’t give up and continue your progress and give reference to the work of other people when you are using them.
AV: Likewise, what are the three points to remember for achieving a good rank in the Discussion ranking?
AL:
- Be active and contribute: take part in competitions and discuss them, share information relevant to competitions, and be a nice member of the community. Don’t forget upvotes to notebooks comments contribute to discussion ranking.
- Know some tricks. If you spend a lot of time on kaggle forums, you’ll notice some trends: each competition has certain topics – about the performance of the models, about the ideas, the list of winning solutions, even topics with memes. You can take advantage of them.
- Be honest. Share relevant information – don’t mindlessly post random articles from the internet. Don’t flood the forums with useless messages.
Andrey’s Advice to the Beginners-
AV: If someone wants to become an economist and wants to incorporate data science with it, what would be your suggestion to him/her for carrying forward these two fields parallelly and integrating them?
AL: I think the best way would be to use ds/ml tools to improve what you are already doing. You are making beautiful visualizations in some software? Try to replicate them in R or Python. You are doing statistical analysis in some software? Also, try Python or R.
I’m not saying that visualizations in Python/R are always better than dedicated software (chances are they are worse), and I’m not saying that using for example Tableau is bad. The idea here is to get used to Python or R because they are usually the main tools of data scientists.
You are using approaches from econometrics to build statistical models? Try to enrich your toolset by using modern algorithms.
HS: Since you have got considerable industry experience in Data Visualization, how has data visualization helped you in your data science journey?
AL: I think that data visualization provides a way to explain ideas and insights to people. On Kaggle visualization is essential to create beautiful and impressive data analysis in notebooks. In industry, visualization helps you to explain ideas in a fast and efficient way. It is much better to show clear and concise visualizations than some tables with the data.
Also, we can show not only some statistical data and insights but such things as model interpretation, visualization of predictions, and many other things.
HS: Can you recommend any data visualization software/tools that have helped you out and which you would like to suggest for beginners?
AL: It could contradict the things which I told earlier, but you could start simply with Excel. It was developed, designed, and refined by a lot of experienced people and you can build good visualizations easily and quickly using it.
But then it will be better to switch to a more common data science toolset – visualization libraries in R and Python.
It is widely accepted that ggplot2 in R is an excellent package for various visualizations. I have little experience with R but still was impressed.
My main programming language is Python and I have used the following libraries:
- Matplotlib– This is the most known library for visualizations in Python. I think it is possible to do almost anything with it, though often it requires you to go deep into documentation and write lots of code.
- Seaborn– This is a wrapper over Matplotlib and it is much easier to use. You can get most of the common types of plots with a single line of code and it is easy to change them.
- Plotly– This is a great library when you want to add some interactivity to your plots. Dropdowns, text pop-ups, and many things can be easily created using it.
- Altair– I was really impressed with it. It is an implementation of the grammar of graphics in python (like ggplot2) and provides a very good syntax. You can do really amazing things with it.
HS: Whenever you get a dataset, which framework/steps you follow to make sure you’re performing EDA comprehensively for any project?
AL: In case you are only starting your journey, I suggest to read some great notebooks to understand what is interesting to people, then start small.
For example, choose a new competition or dataset with many features of different types and try writing a notebook with EDA and modeling. Explore and analyze each feature, by building univariate plots and plots with interactions between features. Make different plots (histograms, bar plots, and many others). Write comments and analysis. Start with simply describing what you see (for example, we see that the distribution of the features is skewered), then gradually start adding analysis (for example, we see that the distribution of the features is skewered – for this type of feature it is completely normal as income distribution naturally looks like this, we can log transform this feature, so that models can use it better). When you add new features, make sure to explain why you did it.
So start simple, then delve deeper into the data with each step and share your train of thought.
End Notes
A lot of stress on EDA was there in this interview, with special stress on visualization was there in this interview. I hope you have had a fruitful experience with this interview.
This is the fifth interview in the series of Kaggle Interviews. You can read some of the past interviews here-
What did you learn from this interview? Are there other data science leaders you would want us to interview? Let me know in the comments section below!


