Binary Cross Entropy/Log Loss for Binary Classification
Introduction
In our lives, while performing a task it is important to understand are we going in the right direction or how far are we from our destination. This information is essential to decide the future course of action.
The machine learning models work in a similar manner. If you are developing a model for a classification problem, that the fruit you are showing to it is Apple or an Orange given we know what the particular fruit is. The model gives the output, how can we evaluate how good (or bad) is the prediction. This is the whole purpose of the evaluation metrics. It tells how good or bad our predictions. Later this information is used for optimizing the model.
Note: If you are more interested in learning concepts in an Audio-Visual format, We have this entire article explained in the video below. If not, you may continue reading.
In this article, we are going to see one such evaluation metric Binary Cross entropy also know as Log loss and how can we calculate it from the data and the predictions of the model.
Objective
- Loss Function for Binary Classification is a recurrent problem in the data science world.
- Understand the Binary cross entropy loss function and the math behind it to optimize your models.
Table of contents
What is Binary Classification?
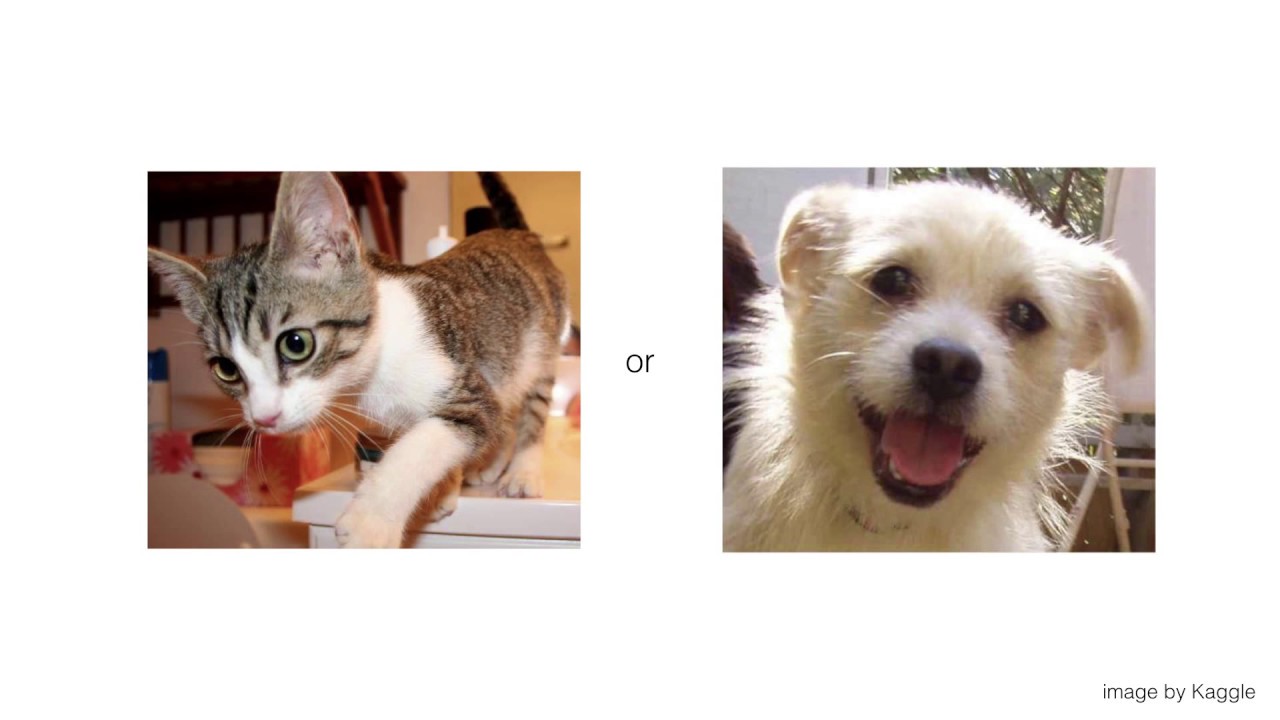
Binary Classification is a problem where we have to segregate our observations in any of the two labels on the basis of the features. Suppose you have some images now you have to put each of them in a stack one for Dogs and the other for the Cats. Here you are solving a binary classification problem.
Similarly, if a machine learning model is identifying mails as ham or spam, it is performing binary classification as it is dividing the objects into two classes.
Introduction to Loss function
Before jumping into Log Loss let’s first understand what is Loss function. Imagine the scenario, Once you developed your machine learning model that you believe, successfully identifying the cats and dogs but how do you know this is the best result?
Here, we are looking for the metrics or a function that we can use to optimize our model performance. The loss function tells how good your model is in predictions. If the model predictions are closer to the actual values the Loss will be minimum and if the predictions are totally away from the original values the loss value will be the maximum.
In mathematical connotations
Loss= abs(Y_pred – Y_actual)
On the basis of the Loss value, you can update your model until you get the best result.
In this article, we will specifically focus on Binary Cross Entropy also known as Log loss, it is the most common loss function used for binary classification problems.
What is Binary Cross Entropy Or Logs Loss?
Binary Cross Entropy is a loss function used in machine learning and deep learning to measure the difference between predicted binary outcomes and actual binary labels. It quantifies the dissimilarity between probability distributions, aiding model training by penalizing inaccurate predictions. It’s widely used in tasks like binary classification, where the goal is to categorize data into two classes.
Binary Cross Entropy, also known as Binary Log Loss or Binary Cross-Entropy Loss, is a commonly used loss function in machine learning, particularly in binary classification problems. It is designed to measure the dissimilarity between the predicted probability distribution and the true binary labels of a dataset.
Binary cross entropy compares each of the predicted probabilities to actual class output which can be either 0 or 1. It then calculates the score that penalizes the probabilities based on the distance from the expected value. That means how close or far from the actual value.
Let’s first get a formal definition of binary cross-entropy
Binary Cross Entropy is the negative average of the log of corrected predicted probabilities.
Right Now, don’t worry about the intricacies of the definition, we will understand that in a while. Just look at the example below.
Predicted Probabilities
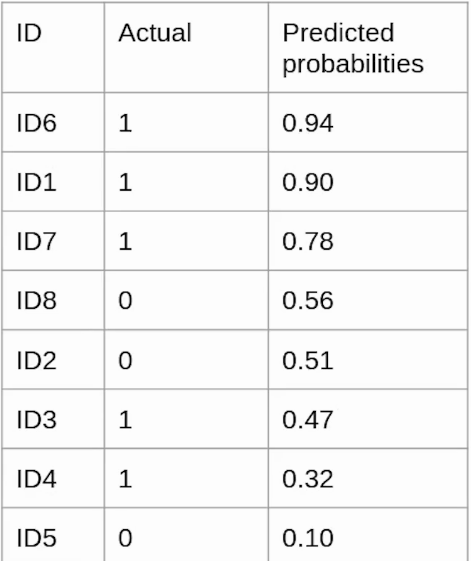
Here in the table, we have three columns
ID: It represents a unique instance.
Actual: It is the class the object originally belongs to.
Predicted_probabilities.: The is output given by the model that tells, the probability object belongs to class 1.
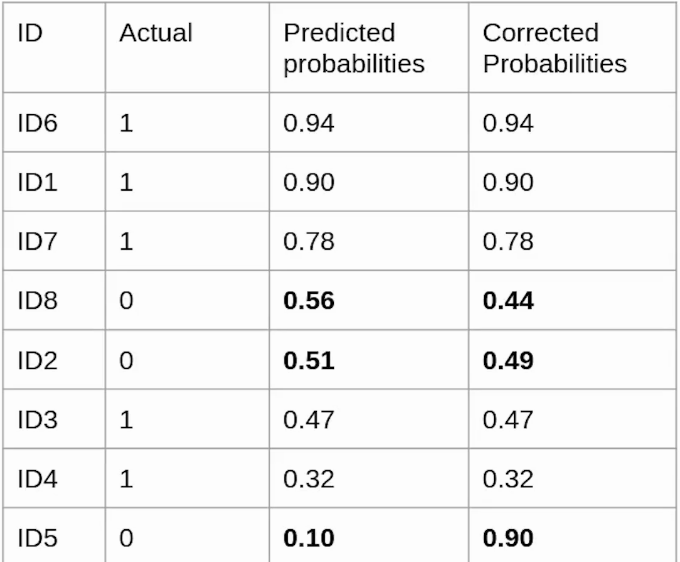
Corrected Probabilities
Now you might have a question, what are corrected probabilities? It is the probability that a particular observation belongs to its original class. As shown in the above image, ID6 originally belongs to class 1 hence its predicted probability and corrected probability is the same i.e 0.94.
On the other hand, the observation ID8 is from class 0. In this case, the predicted probability i.e the chances that ID8 belongs to class 1 is 0.56 whereas, the corrected probability means the chances that ID8 belongs to class 0 is ( 1-predicted_probability) is 0.44. In the same way, corrected probabilities of all the instances will be calculated.
Log(Corrected probabilities)
Now we will calculate the log value for each of the corrected probabilities. The reason behind using the log value is, the log value offers less penalty for small differences between predicted probability and corrected probability. when the difference is large the penalty will be higher.
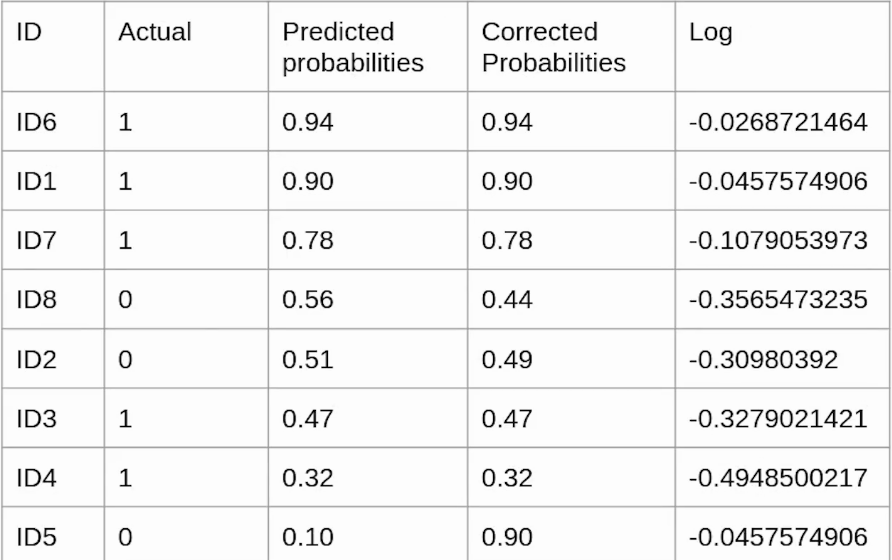
Here we have calculated log values for all the corrected probabilities. Since all the corrected probabilities lie between 0 and 1, all the log values are negative.
In order to compensate for this negative value, we will use a negative average of the values
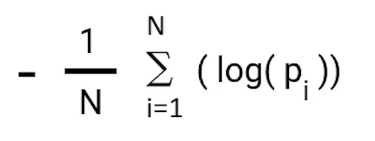
The value of the negative average of corrected probabilities we calculate comes to be 0.214 which is our Log loss or Binary cross-entropy for this particular example.
Further, instead of calculating corrected probabilities, we can calculate the Log loss using the formula given below.
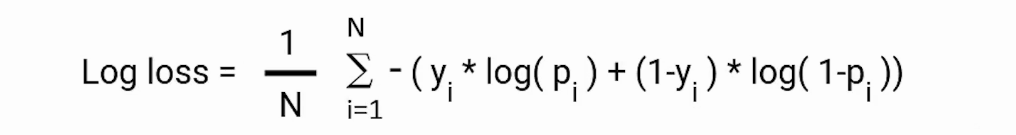
Here, pi is the probability of class 1, and (1-pi) is the probability of class 0.
When the observation belongs to class 1 the first part of the formula becomes active and the second part vanishes and vice versa in the case observation’s actual class are 0. This is how we calculate the Binary cross-entropy.
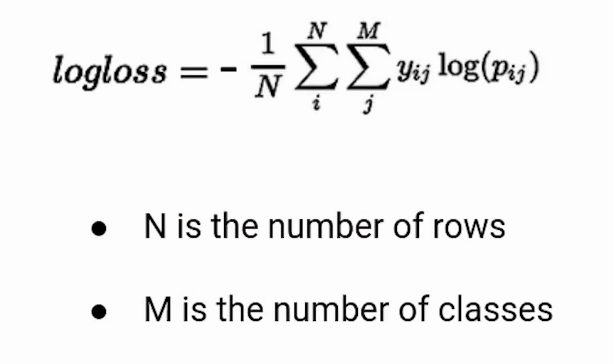
Binary Cross Entropy for Multi-Class classification
If you are dealing with a multi-class classification problem you can calculate the Log loss in the same way. Just use the formula given below.
Frequently Asked Questions
A. Binary Cross Entropy is used for binary classification tasks with two classes, while Categorical Cross Entropy is used for multiclass classification tasks with more than two classes. The choice of loss function depends on the specific problem and the number of classes involved.
A. Binary cross entropy, also referred to as logarithmic loss or log loss, is a metric used to evaluate models by measuring the extent of incorrect labeling of data classes. It penalizes the model for deviations in probability that result in misclassification of the labels. When the log loss value is low, it indicates a high level of accuracy in the model’s predictions.
End Notes
To summarize, in this article we learn what is Binary Cross-Entropy and how can we calculate it, from our data and the predicted values. It is important to understand the metrics you are using in your models in order to optimize their performance.
If you are looking to kick start your Data Science Journey and want every topic under one roof, your search stops here. Check out Analytics Vidhya’s Certified AI & ML BlackBelt Plus Program.
If you have any questions, let me know in the comments section!


I am lost under heading of Corrected probabilities "On the other hand, the observation ID8 is from class 0. In this case, the predicted probability i.e the chances that ID8 belongs to class 1 is 0.56 whereas, the corrected probability means the chances that ID8 belongs to class 0 is (1-predicted_probability) is 0.44. In the same way, corrected probabilities of all the instances will be calculated." In above paragraph why are you calculating corrected probability using (1-predicted_probability)?