


Over the last five years, unfairness in machine learning has gone from almost unknown to hitting the headlines frequently, and new cases of unwanted bias introduced in automated processes are frequently discovered. However, there is still no “one-size-fits-all” standard machine learning tool to prevent and assess such data bias. In this article, we will deal with how to explain unfairness in a machine learning algorithm.

In 2014, in a report called Big Data: Seizing Opportunities and Preserving Values, the Executive Office of President Obama pointed out the fact that “big data technologies can cause societal harms beyond damages to privacy, such as discrimination against individuals and groups." This was the first time unfairness in machine learning had been officially recognized as a potential harm.
Since then, we’ve been able to observe numerous instances of unfairness in machine learning use cases. In 2015, Amazon shut down its machine learning-based job candidate evaluation tool because it turned out to be biased against women. The model had learned that there are fewer women in technology jobs and interpreted this preexisting bias negatively. In 2016, the independent journal ProPublica discovered that a recidivism prediction model used by the U.S. Department of Justice to evaluate inmates in trial was biased against black people.
Unfairness can be explained at the very source of any machine learning project: the data. This is because the data collection often suffers from our own bias. We focus on six causes of unfairness: limited features, skewed samples, tainted examples, sample size disparity, proxies, and masking.
Vocabulary Alignment
Through this article, we will use the word “data” to qualify both input data and output data. Input data is used by a machine learning model to generate its output, the target information to estimate.
Limited Features
As machine learning is based on collecting a significant number of observations for a given task and learning from these examples, what should happen if a model is trained on non-representative data?
Even though errors during data collection may occur, in an optimal data collection workflow, the error distribution among observations should be as close as possible to white noise, meaning equally distributed without regard to the specific observations. In practice, as demonstrated by Professor Kate Crawford, “because not all data is created or even collected equally, there are ‘signal problems’ in big datasets, dark zones or shadows where some citizens and communities are overlooked or underrepresented.”
By design, our data collection can only partially capture sophisticated real-life phenomena. This reduction can be so drastic that the collected data will not be granular enough to catch the differences between subgroups, resulting in poorer data quality for observations of such groups. This difference in data quality will have a direct impact on model performance — the models with poor data quality will likely be biased toward the subpopulation.
Examples of such limited features and consequences can be found in automotive insurance pricing. The price of one’s automotive insurance contract is based on the risk of accident among people similar to this particular person. The fairness problem raised by such clustering approach is that if the person drives better than the average people of her cluster, her insurance price will be the same as the rest of the group because the model is not precise enough to differentiate this person from poorer drivers in her group.

Skewed Samples
A second unfairness cause is skewed samples and is a direct consequence of using a data collection process that is already biased because of other causes of unfairness, such as limited features. This biased data collection process may lead to biased models and, when business decisions are based on such models, their consequences might have an adverse impact which will reinforce this data bias. This can be called a biased feedback loop.
In fact, in the same way sampling from a skewed distribution reinforces the skewness by ruling out less frequent observations, biased models will perform best only on the privileged class, and their output will tend to rule out unprivileged classes. If business decisions based on such biased models impact the data collection process, the gathered information will be more and more focused on the privileged class. This will result in a vicious circle where unfairness continues to grow in the process.
To illustrate such biased feedback loops in practice, we can take the example of the Google Flu Trends failure. Google Flu Trends is a machine learning model developed by Google to measure the intensity of flu outbreaks by using search data. However, the model failed at detecting the 2009 A/H1N1 flu pandemic and then kept overestimating flu outbreaks between 2011 and 2014.
The study’s lead author David Lazer et al. suggested that this overestimation was induced by inside changes at Google on the search suggestion service, consequently to the A/H1N1 detection failure. The service started suggesting flu-related queries to healthy people. Consequently, the number of flu-related searches increased significantly, and that change on the search suggestion service ended up by increasing the bias in flu outbreak detections between 2011 and 2014.

Tainted Examples
In supervised learning tasks, it’s of course crucial that the targets of the classification tasks at hand is correct. However, what would happen if the target isn’t well-defined, or if the features are biased?
In practice, defining the target is often not as trivial as drawing the line between cats and dogs.
In real use cases, people often have to create the target based on arbitrary decisions."
To illustrate this we will take into consideration the need for many companies, such as Amazon, to sort job candidates automatically given the vast number of candidates. The model-making process would involve computing a collection of features for each candidate (such as highest diploma level, school attended, years of experience, etc.) and using a target describing if the candidate is good or not. However, as this criterion is not absolute, the person in charge of the model design will have to create this target.
An example of a possible target is whether the candidate was recruited or not (binary classification case) and another one could be the work evaluation scores of recruited people (continuous prediction case). Both targets can be used to sort candidates, the second one even allows recruiters to rank them. However, both targets are based on human appreciation, which can be biased towards race. This was demonstrated by Stauffer & Buckley, who showed evidence of bias against black people in work evaluations. In the example, the model would learn this data bias and replicate it, resulting in a recruiting process discriminating black people.
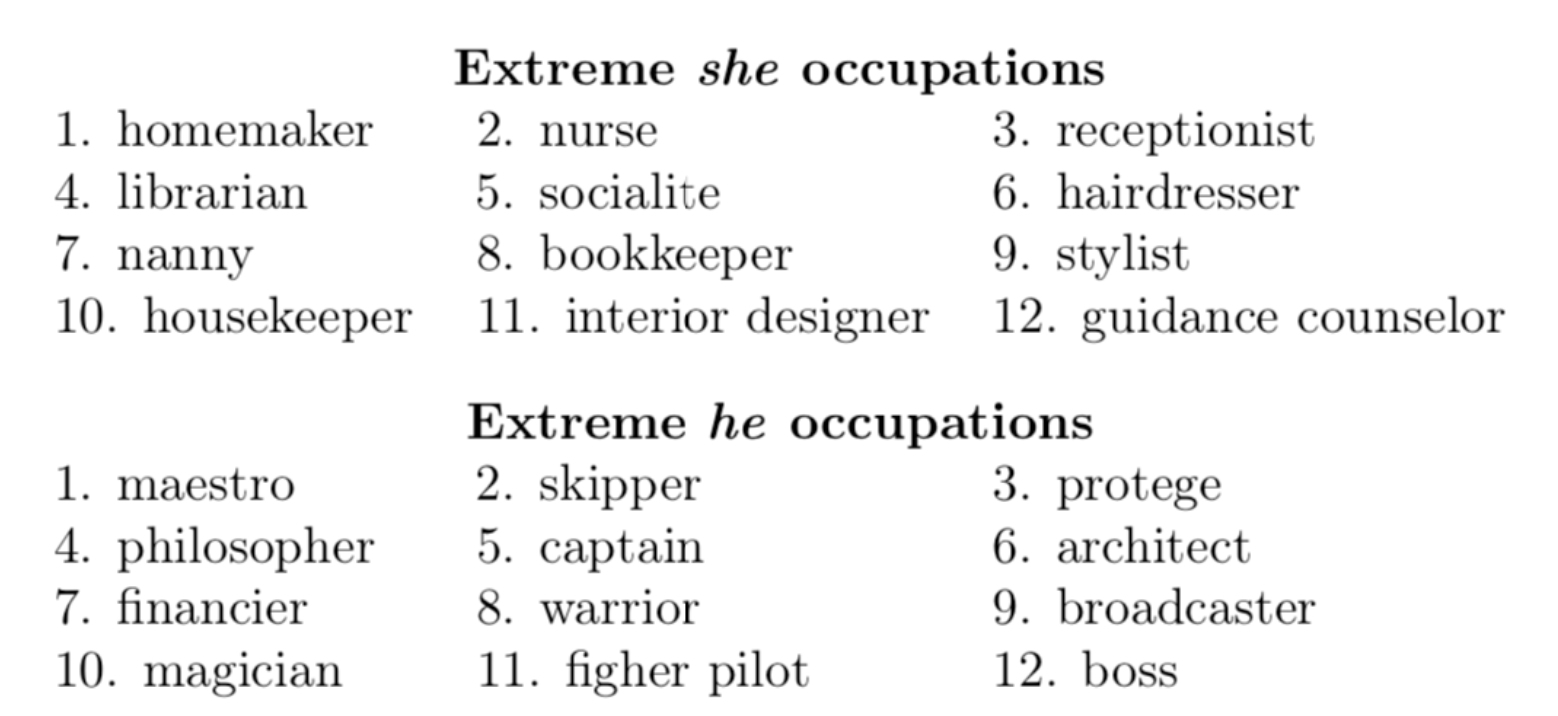
We can demonstrate similar behavior when it comes to the features used in a model. Evidence of such bias transmission can be found in the w2vNEWS natural language processing model. Bolukbasi et al. proved that word embeddings produced by w2vNEWS, trained on Google News, “exhibit female/male gender stereotypes to a disturbing extent” because the model had captured genre bias in the way columnists were writing about men and women. The figure below displays the occupation word embeddings closest to the “she” and “he” embeddings respectively. In a fair model, most occupations should be equally close to both gender pronouns.
Sample Size Disparity
Given that all of our previous examples were based on biased training data, does this mean that all fairness problems boil down to inherent data unfairness that is then captured in the models ?
This is not always the case. To do so, suppose we have access to totally unbiased data that we assume to be imbalanced, meaning that there are subpopulations in our dataset with strong differences in size.
According to Moritz Hardt, for a given set of features, “the error of a classifier often decreases as the inverse square root of the sample size. Four times as many samples means halving the error rate.”
The performance issue becomes linked with fairness because, in practice, there is generally less data available for the minority group. Consequently, models will tend to perform worse on minorities than on the overall population, if they fail to generalize on those groups."

In practice, sample size disparity could be aggravated when features used by the classifier could behave differently, even in opposite ways, in the majority and minority groups.
An example that demonstrates such inversion of correlation of the same feature among groups is illustrated by the 2011 Google Nymwars scandal. Google tried to implement a real-name policy on Google+ but the algorithm tended to predict ethnic names as fake names as their structure was different from white American names. The difference can be explained because white American names are pretty standard and are composed of a first and a last name, while ethnic names are far more diverse and sometimes mononyms.
Proxies
All the precited potential causes of unfairness emphasize the need to carefully select data before training any machine learning model that could impact people. However, even if protected sensitive attributes (gender, race, etc.) are removed, machine learning models can still perform poorer on minority classes than on the overall population. These differences in performance might be explained when remaining features act as proxies of the protected attribute.
This phenomenon is called “redundant encodings”, meaning that the protected attribute is encoded across one or multiple features in the dataset, making the removal of the protected attribute useless. In this case, in the same way as tainted examples might happen, the model will catch already present inequalities and learn to reproduce them. An example of these encodings can be found in New York City, where household income can be used as a strong proxy for race.

The trickiest part is that proxies might not be composed of only one feature, but of a combination of multiple features, which make them harder to detect. As an example, Yeom, Datta, and Fredrikson tried to predict the crime rate per community based on the C&C dataset (composed of U.S. census and FBI crime reporting data). Even after removing the 32 features explicitly linked to race out of the 122 in total, they managed to find a proxy for race consisting of a combination of 58 features out of the 90 remaining.
This proxy had an association with race of 0.85, while the single feature with the strongest association in the dataset only had an association of 0.73. Having to check combinations of dozens of features makes identifying proxies very hard in practice.
A second problem with proxies occurs when dealing with limited features. As explained before in this article, limited features generate bias because data lacks enough granularity to explain clearly specific behaviors linked to the minority groups. However, by increasing data granularity for minority classes, models could discover unwanted patterns of already existing discrimination, and learn them in an adverse effect.
Masking
In all of the causes for potential data bias previously identified, we were presuming that the bias was introduced unintentionally during data collection. However, both Barocas et al. and Dwork et al. agree on highlighting a source for potential bias, which is this time intentional. This last source of bias is called masking and consists of purposely using all of the precited causes of bias to voluntarily discriminate a given subpopulation.
For wrongfully intentioned people, masking has the advantage to be implemented in plenty of different ways, all of which are difficult to detect. They could either bias the data collection process to be sure that the resulting model is going to present the desired bias (using skewed samples) or they could also preserve the unfairness in already existing processes by ensuring that the outcomes of those processes are used as supposedly fair and impartial features (using tainted examples).
They could also use a set of features so general that they don’t allow the identification of particular behaviors in minority groups, resulting in a model that only works well for the majority group (using limited features).
Conclusion
We have highlighted six potential causes of unfairness in machine learning, all rooted in the data used to train subsequent models. Of course, such data bias have deeper societal consequences that goes beyond what those models learn.
Machine learning algorithms are often thought as a legitimate and bias-free way to automatize human processes, such as in job candidates’ ranking, for example. By learning underlying bias in the human processes, the model will replicate this data bias without being detected.
However… we never explicitly defined unfairness in any of those situations. This will be necessary in order to detect unfairness in machine learning algorithms and will be the subject of our next blog post on fairness and data!