


Dataiku and Kayrros understand the value of unconventional data in enabling faster action with hyper-agility. Our recently announced partnership represents a shared ethos in valuing cross-collaboration between teams and the ability to use data and new technology to garner deeper insights. A recent example showcased how the combination of the Kayrros asset observation platform with Dataiku’s end-to-end AI and machine learning platform can boost decision-making and demonstrate how quick and informed thinking can prove to be a key differentiator in the manufacturing space.
Today’s industrial organizations face highly uncertain conditions following the peak of COVID-19-related disruption. As countries around the world take different positions in managing the pandemic, it’s nearly impossible to precisely evaluate the recovery of any industrial sector on a global or regional level, including the impact across the supply chain.
Dataiku and Kayrros built a near real-time activity index for the automobile industry supply chain, highlighting the accuracy of this approach to quickly detect the impact of small and large changes on a global scale — months before any publicly released data became available. The team focused on the U.S. and compared the impact of the virus on several manufacturers (Fiat Chrysler, Ford, General Motors, Tesla, and Toyota), both in terms of the activities of these companies at their major sites and in any subsequent consequences on their respective supply chains.
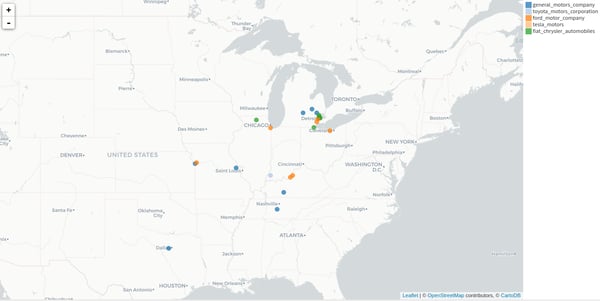
Locations of the car manufacturing sites monitored for the purpose of this study plotted in Dataiku DSS
The Kayrros asset observation platform can monitor hundreds of thousands of industrial assets worldwide, leveraging alternative data such as satellite imagery, anonymized geolocation positions, and news and social media with off-the-shelf models. In the joint Kayrros/Dataiku study, data from 31 automotive assembly plants in the U.S. was added to the platform, including anonymized geolocation data for each site, dating back to January 2017 to follow the evolution of workforce levels.
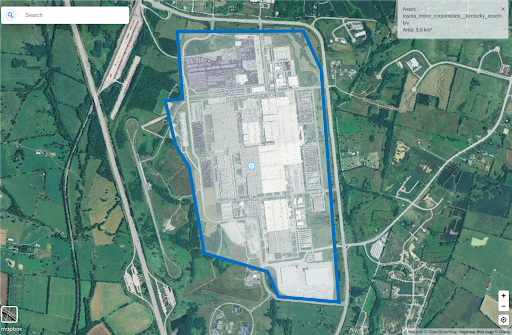
A Toyota assembly plant in Kentucky (U.S.) added on the Kayrros platform; Image credit: Mapbox, the contributors of OpenStreetMap
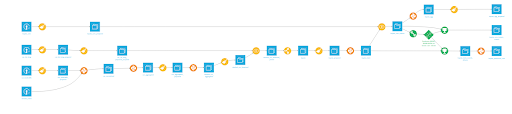
Once downloaded and processed by Kayrros, the data was integrated via the Kayrros API into Dataiku to be cleaned and combined for easy visualization. Off-the-shelf Dataiku text cleaning functions parsed site names before anonymized geolocation data was aggregated by manufacturer and by area using the Dataiku “compute distance between geopoints” function. The data was normalized twice, first to smooth the results with the provider’s index and second to define a common point for comparison. This was set as June 2019. For the purpose of this example, we also compared Kayrros activity measurements with publicly available month-by-month Toyota car production data in the U.S. Finally, a Dataiku binarization recipe was used to define thresholds to determine site status and set up prediction and alert features.
So, how did we do? Well, in evaluating the post-COVID-19 recovery in the U.S. automobile industry, we first found that production has resumed on all sites, but with varying speeds of recovery. We observed a clear ramp-up in workforce levels across all car manufacturers after lockdowns forced the closure of each site. As an interesting bonus, we also observed the General Motors employee strike in September 2019.
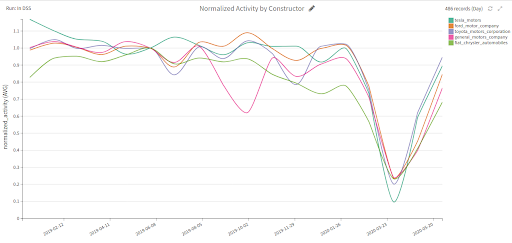
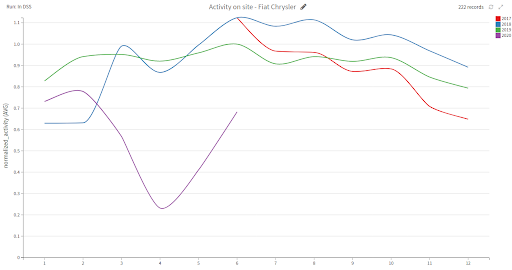
While Tesla and Toyota seem to have returned to normal activity, recovery of other companies such as Fiat Chrysler, Ford, and General Motors has been slower, with workforce levels at just 80% of those of June 2019. For reference, we also show below the aggregated activity measured at Fiat Chrysler industrial sites over the last four years.
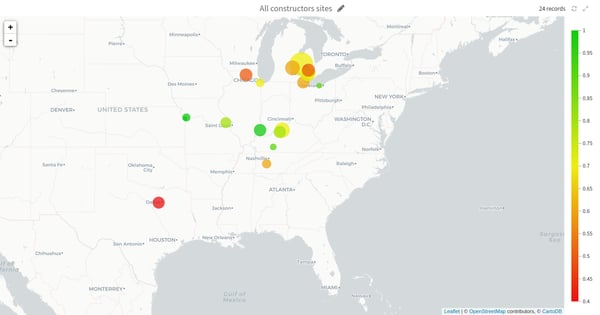
Second, the speed of recovery seemed to depend on the locations of the manufacturers’ sites with the recovery of each site perhaps being affected by the diversity of the measures taken in different U.S. states. On the map below, the circle size shows the factory size, whereas the color indicates the degree to which staff levels have recovered, compared to the June 2019 levels. Green represents full recovery. The more severe lockdowns in the northern part of the country likely limited the speed of recovery.
It is important to note that, though recovery is on the way, there is no guarantee that future stay-at-home orders will not happen. Given the uncertainty of the current environment, it will be pivotal to step away from historical data and tap into real time, alternative data sources to help organizations navigate the upcoming weeks and months.
Using Unconventional Data to Monitor Automotive Supply Chains in Near Real Time
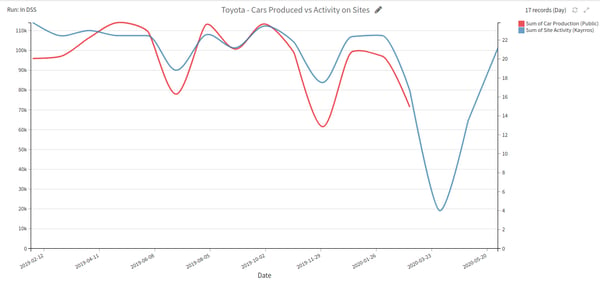
Our next step was to focus on a given supplier and see how we could monitor its activity as well as its supply chain. Our first finding was that Kayrros data provided insights months ahead of publicly released reports. Indeed, the comparison between Kayrros measured activity data and publicly available Toyota production data demonstrated how unconventional data can be leveraged to provide reliable, near real-time insights. Kayrros provides data with a one day lag, whereas Toyota car production data is released with an average lag of 60 days.
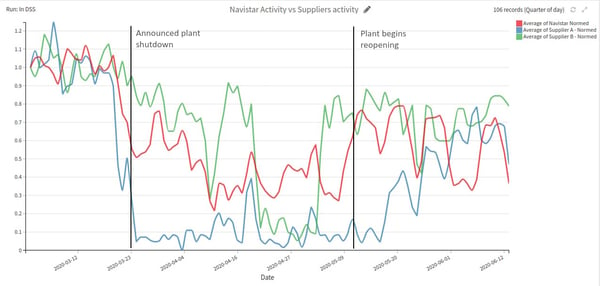
Our second finding was that global supply chain disruptions could indeed be understood and anticipated by leveraging alternative Kayrros data within Dataiku. The shutdown and reopening of major production sites impact supply chains and staff levels. We took a closer look at Navistar, a General Motors plant near Springfield, Ill. Kayrros activity data shows that prior to Navistar’s plant shutdown, one supplier reduced staff levels while another ramped them up shortly before Navistar’s plant reopening.
Based on the observation that suppliers’ shutdowns and restarts could be good predictive indicators of main site activity, we leveraged Dataiku to set up alerts on suppliers’ activity levels. Many other ancillary use cases leveraging Dataiku's powerful machine learning capabilities could then be derived from this first signal, notably to reinforce internal activity forecasting models. Leveraging the Kayrros asset observation platform to analyze changes in car inventories using SAR satellite imagery could be another promising lead to follow.

Sentinel-1 European Space Agency Copernicus constellation image of Navistar facility in Springfield, Ill.
Looking Ahead
Alternative data has shown it can deliver unprecedented insight on supply chain monitoring, with significant potential across different sectors, such as manufacturing, distribution, financial services, and public institutions. The integration of alternative data with public and enterprise data using Dataiku gives a unique edge to organizations in an increasingly uncertain environment. Combining Kayrros data with Dataiku’s Enterprise AI and machine learning platforms makes it possible to anticipate and analyze the world’s most disruptive events, now and in the future.