Part of the the series: Doing Power BI the Right Way (link)
Validation 301: Creating a Validation Report Solution, Part 2
We often have users of a business intelligence solution tell us that they have found a discrepancy between the numbers in a Power BI report and a report produced by their line-of-business (LOB) system, which they believe to be the correct information.
Using the LOB reports as a data source for Power BI is usually not ideal because at best, we would only reproduce the same results in a different report. We typically connect to raw data sources and transform that detail data, along with other data sources with historical information to analyze trends, comparisons and ratios to produce more insightful reports.
However, if the LOB reports are really the north star for data validation, these can provide an effective means to certify that a BI semantic model and analytic reports are correct and reliable.
This is a pattern that I have applied for consulting customers. My current client refers to the main Power BI report and dataset as their “dashboard” solution. The data model is large and complex with sophisticated reports used monthly by hundreds of users. The dataset is setup with a scheduled refresh. The “dashboard” solution has been thoroughly tested and we are careful to only apply updates and enhancements infrequently under a rigorous application lifecycle management process.
At the end of each month, a user exports their LOB report to an Excel file and drops it into a SharePoint library. I have one consulting client who use an automation tool to essentially open the LOB application, punch in the right keystrokes and export the report to a file at the end of every month.
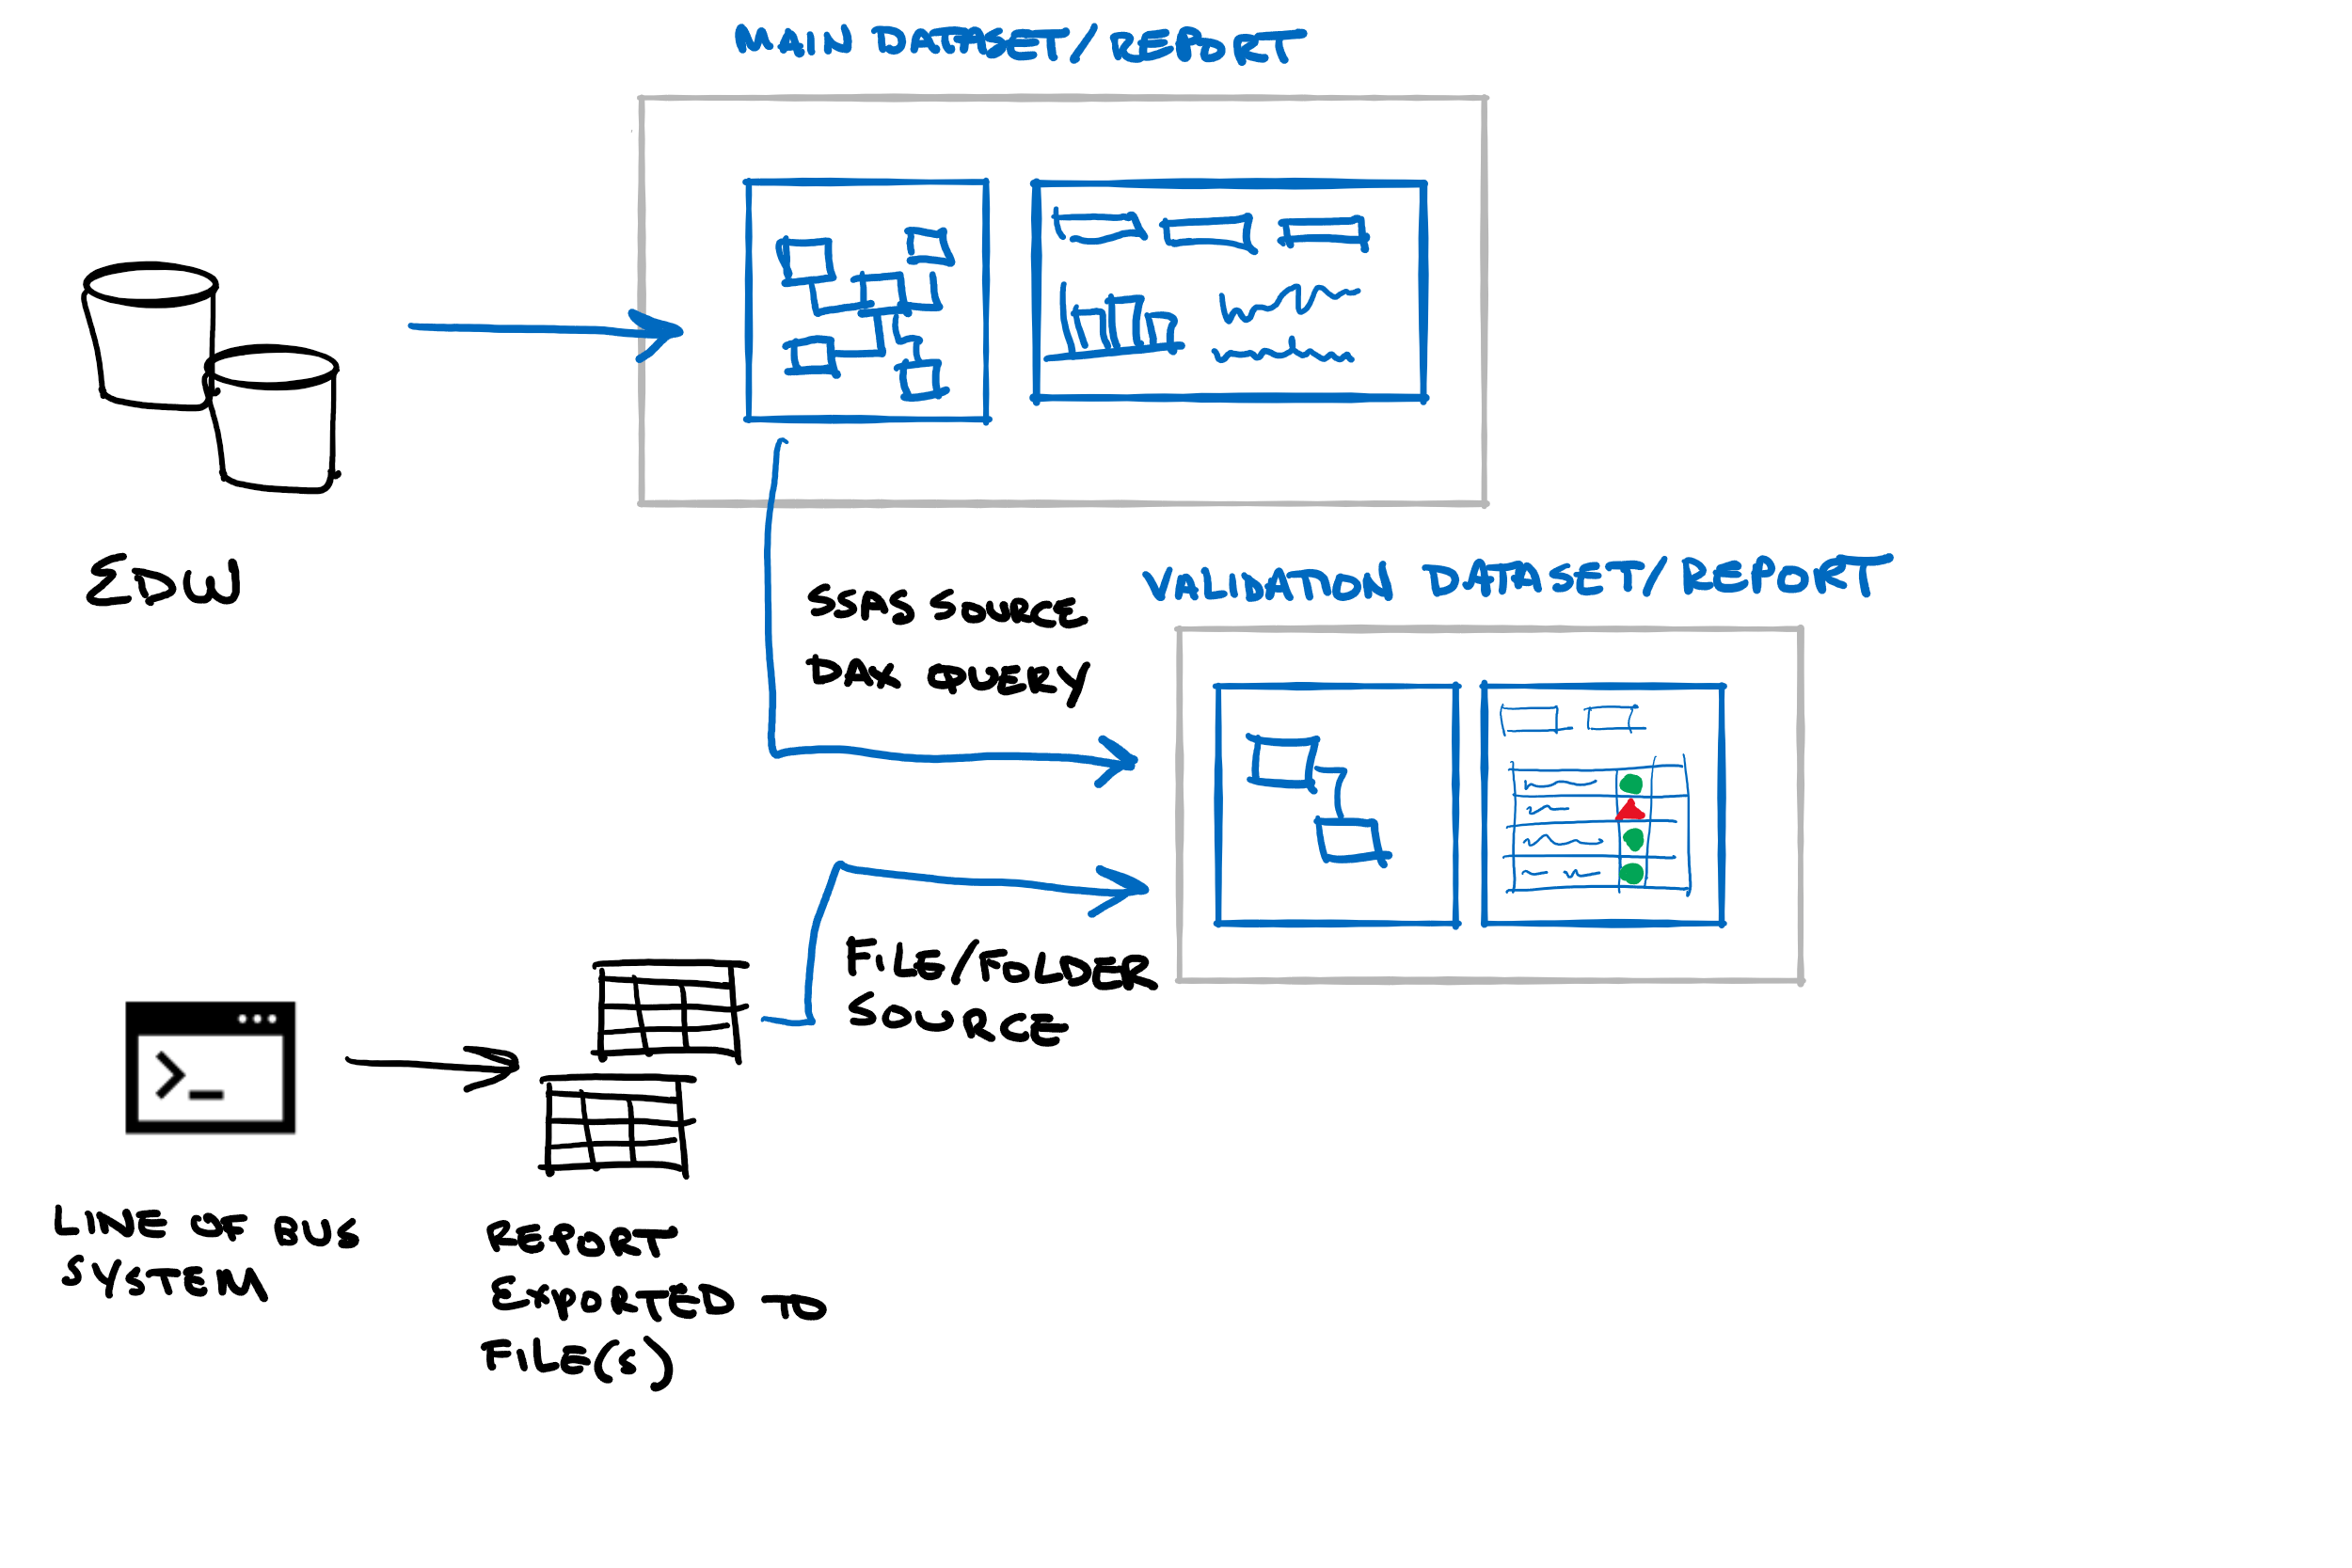
The format of these exported reports have proven to be fragile and we don’t want to risk destabilizing the main Power BI “dashboard” solution. So, rather than importing the validation files directly into the main dataset, I have created a separate Power BI project with a dataset & report that has two sources. The first data source for the validation report connects to the main “dashboard” Power BI dataset using the Analysis Services connector and the XMLA endpoint. A DAX query is issued to return values to compare with the LOB report totals. The second data source for the validation report imports the validation files that were exported from the LOB report. If that import process were to fail for any reason, it doesn’t affect the main dashboard solution.
This diagram depicts the validation solution at a high level. The main Power BI “dashboard” solution get its data from the corporate EDW. That data is processed through rigorous ETL pipelines and contains data extracted from multiple systems used by the corporation.
A lightweight DAX query imports summarized results from the main dataset into the validation dataset.
Before we go any further, I just want to make the point that in most normal Power BI data models, I would never import data from another published Power BI or SSAS data model. That’s just a bad idea and can make it very difficult to trace data lineage. Do not use DAX queries as a data source for your regular report models. This validation report is a rare and appropriate exception to the rule.
The second data source for the validation solution is a set of files exported from reports produced by the LOB system. These reports only contain summary information but can be compared to totals from our Power BI solution. Values from the two sources are compared and the validation report shows whether they match or fail validation.
Just a note about the decision to create a separate dataset. There were two reasons for this:
1. We could not control the format of the validation files. If the file format were to change, it would cause an error and stall our scheduled refresh cycle for a large mission-critical report used by several hundred high-level employees (whose job is it to tell the CEO why his dashboard doesn’t work?)
2. Today we do not have the ability to use a live connection to a Power BI dataset in a composite model along with other sources, but we will in the near future. This capability doesn’t address problem #1 but will certainly change the way I think about architecting large, multi-source models in the future.
Writing the DAX query to read the summary values from the main Power BI “dashboard” dataset was a great learning experience. Although I am now pretty good at writing DAX queries by hand after a couple of these projects, the easier way to get started is to allow Power BI Desktop to generate the query for you. Here are the steps using the ContosoDW dataset as an example:
- Add a table visual to the report canvas. Add the same field and measure used in the LOB report to be used for comparison.
- Turn off totals for the table visual.
- Add and set slicers or filters to equate the LOB report results.
- On the View menu in Power BI Desktop enable the Performance Analyzer.
- In the Performance Analyzer pane display to the right side of the report canvas, click the Refresh visuals link.
- Click the plus sign next to the table visuals to expand the performance counters for that visual.
- Click the Copy query link.

The DAX query is now in the Windows clipboard and can be used to run the same query that the designer produces to populate the table visual. To test and modify the query, do the following.
- Make sure you have the latest version of DAX Studio installed. If not, install it from daxstudio.org. Save your work, close and reopen Power BI Desktop after installing DAX Studio.
- From the External Tools menu in Power BI Desktop, click DAX Studio. This opens DAX Studio with a query session connected to the local Power BI dataset.
- Paste the clipboard contents to the query window and run the query.

Here’s the query that was generated by Power BI:
DEFINE
  VAR __DS0FilterTable =
    TREATAS({2009}, 'Order Date'[Year])

  VAR __DS0FilterTable2 =
    TREATAS({"October"}, 'Order Date'[Month Name])

  VAR __DS0Core =
    SUMMARIZECOLUMNS(
      'Product'[Category Name],
      __DS0FilterTable,
      __DS0FilterTable2,
      "Online_Sales_Qty", '_Measures'[Online Sales Qty]
    )

  VAR __DS0PrimaryWindowed =
    TOPN(501, __DS0Core, 'Product'[Category Name], 1)

EVALUATE
  __DS0PrimaryWindowed

ORDER BY
  'Product'[Category Name]
This code can be simplified for our needs. The essential code is the expression using the SUMMARIZECOLUMNS function. You can disregard everything after that. Make the following changes to simplify the DAX query code:
- Delete everything after the closing parenthesis for the SUMMARIZECOLUMNS function.
- Remove the variable line just before the SUMMARIZECOLUMNS function and replace it with “EVALUATE”
The resulting query code should look like this:
DEFINE
  VAR __DS0FilterTable =
    TREATAS({2009}, 'Order Date'[Year])

  VAR __DS0FilterTable2 =
    TREATAS({"October"}, 'Order Date'[Month Name])
EVALUATE
    SUMMARIZECOLUMNS(
      'Product'[Category Name],
      __DS0FilterTable,
      __DS0FilterTable2,
      "Online_Sales_Qty", '_Measures'[Online Sales Qty]
    )
This is the query I would use to populate a new table in my validation dataset. Just use Get Data to open the Power Query editor, create a new SQL Server Analysis Services connection, paste the workspace path for a premium enabled workspace and connect to the published dataset for my main Power BI solution. Then finally, paste this query code into the query window.
Next step is to import the validation file(s) that were exported from the LOB report. In our validation solution, I used the SharePoint connector and imported all files with a predefined file name prefix. After the validation files are imported, make sure that the column data types are compatible, load the table and wire-up a relationship between the two tables. In our last validation solution, I created a new measure that compares a measure from the summary table imported from the main “dashboard” solution dataset with a comparable measure from the validation file source table. Measures calculated the difference and the % difference between the two. I then used a KPI indicator icon in the table visual using conditional formatting to show if the differences were within an acceptable range.
This screen capture from the validation page has the real data blurred out but you can see the grouping and comparisons resulting in either green or red indicators.

Each month, I receive an email from our user who is responsible for the report validation. He tells me that at a quick glance he is able to verify that the totals from their line-of-business application and Power BI solution match, and that the executive leaders and financial analysts who use these reports can be certain that they are accurate and reliable. When an item doesn’t match, they can pinpoint the account in question and usually are able to track it down to a data refresh timing issue or a mistake made in their source system that hasn’t yet been reconciled.
We are now setting up alerts using KPI tiles on a dashboard that will message key users when validation either succeeds or fails in key areas. As a result, the confidence in this solution has increased significantly and business leaders trust the information they get from these reports.

Nice! I’ve created a similar solution to validate system migrations. A report would compare the data in the existing system with the data in the new system.
Nice, good job Paul!!!
Thanks, Man
Great reading and excellent solution! Thanks for sharing Paul