


We’ve spoken before about basic concepts in data science and machine learning algorithms, so by this point, you might have already created a machine learning model. But now the question is: how can you tell if it’s a good model?
In our earlier article, we talked about training sets and test sets — this is when you break your data into two parts: one to train your model and the other to test it. After you’ve trained your model using the training set, you want to test it with the test set. Makes sense, right? So now, which metrics should you use with your test set? It depends on what kind of model you’ve built.

Metrics for Evaluating Models
There are several metrics for evaluating machine learning models, depending on whether you are working with a regression model or a classification model.
For regression models, you want to look at mean squared error and R2. Mean squared error is calculated by computing the square of all errors and averaging them over all observations. The lower this number is, the more accurate your predictions were. R2 (pronounced R-Squared) is the percentage of the observed variance from the mean that is explained (that is, predicted) by your model. R2 always falls between 0 and 1, and a higher number is better.
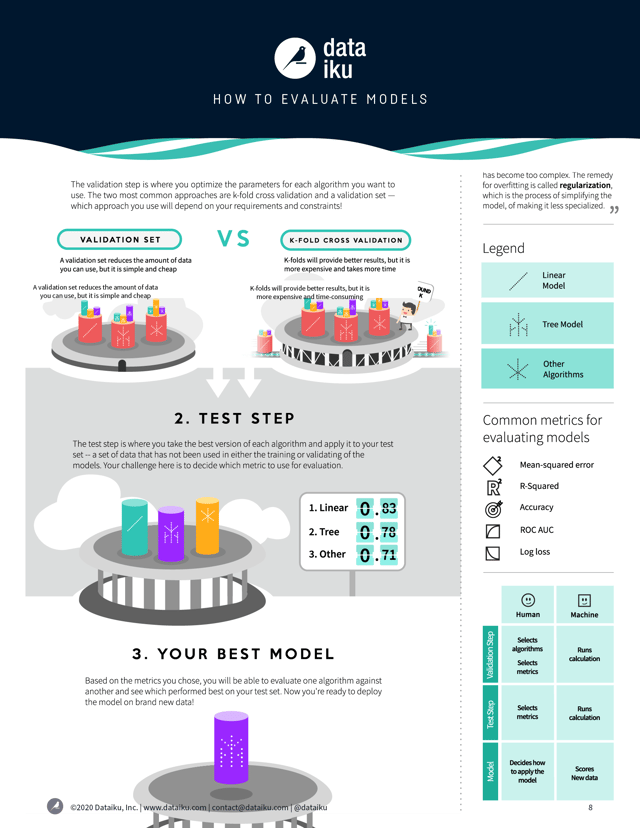 An infographic that illustrates the validation and testing process.
For classification models, the most simple metric for evaluating a model is accuracy. Accuracy is a common word, but in this case we have a very specific way of calculating it. Accuracy is the percentage of observations which were correctly predicted by the model. Accuracy is simple to understand, but should be interpreted with caution, in particular when the various classes to predict are unbalanced.
Another metric you might come across is the ROC AUC, which is a measure of accuracy and stability. AUC stands for "area under the curve." A higher ROC AUC generally means you have a better model. Logarithmic loss, or log loss, is a metric often used in competitions like those run by Kaggle, and it is applied when your classification model outputs not strict classifications (e.g., true and false) but class membership probabilities (e.g., a 10% chance of being true, a 75% chance of being true, etc.). Log loss applies heavier penalties to incorrect predictions that your model made with high confidence.
Overfitting and Regularization
When you train your model using the training set, the model learns the underlying patterns in that training set in order to make predictions. But the model also learns peculiarities of that data that don’t have any predictive value. And when those peculiarities start to influence the prediction, we’ll do such a good job at explaining our training set that the performance on the test set (and on any new data, for that matter) will suffer. This is called overfitting, and it can be one of the biggest challenges to building a predictive model.
The remedy for overfitting is called regularization, which is basically just the process of simplifying your model or of making it less specialized.
For linear regression, regularization takes the form of L2 and L1 regularization. The mathematics of these approaches are out of our scope in this post, but conceptually they’re fairly simple. Imagine you have a regression model with a bunch of variables and a bunch of coefficients, in the model y = C1a + C2b + C3c…, where the Cs are coefficients and a, b, and c are variables. What L2 regularization does is reduce the magnitude of the coefficients, so that the impact of individual variables is somewhat dulled.
Now, imagine that you have a lot of variables — dozens, hundreds, or even more — with small but non-zero coefficients. L1 regularization just eliminates a lot of these variables, working under the assumption that much of what they’re capturing is just noise.
For decision tree models, regularization can be achieved through setting tree depth. A deep tree — that is, one with a lot of decision nodes — will be complex, and the deeper it is, the more complex it is. By limiting the depth of a tree, by making it more shallow, we accept losing some accuracy, but it will be more general.
Introducing K-Fold Cross-Validation and the Validation Set
When you build a model, don’t wait until you’ve already run it on the test set to discover that it’s overfitted. Instead, the best practice is to evaluate regularization techniques on your model before touching the test set. In some ways, this validation step is just stage two of your training.
The preferred method of validating a model is called K-fold Cross-Validation. To do this, you take your training set and split it into some number — called K (hence the name) — of sections, or folds. Then, for each combination of parameters (e.g., tree depth of five and 15 trees), test the model on the fold and calculate the error after training it on the rest of the training set NOT part of the fold — and then continue doing this until you’ve calculated the error on all K folds. The average of these errors is your cross-validated error for each combination of parameters.
Then, choose the parameters with the best cross-validated error, train your model on the full training set, and then compute your error on the test set — which until now hasn’t been touched. This test error can now be used to compare with other algorithms.
The drawback of K-fold cross-validation is that it can take up a lot of time and computing resources. A more efficient though less robust approach is to set aside a section of your training set and using it as a validation set. The validation set could be the same size as your test set, so you might wind up with a split of 60-20-20 among your training set, validation set, and test set. Then, for each parameter combination, calculate the error on your validation set, and then choose the model with the lowest error to then calculate the test error on your test set.
This way, you will have the confidence that you have properly evaluated your model before applying it in the real world.