With the massive explosion of data across the enterprise — both structured and unstructured from existing sources and new innovations such as streaming and IoT — businesses have needed to find creative ways of managing their increasingly complex data lifecycle to speed time to insight. At Cloudera, we set out to directly address these lifecycle challenges through the Cloudera Data Platform (CDP) — the only hybrid-cloud, multi-cloud enterprise data platform built for the full data lifecycle.
Over the past months, we’ve been busy innovating and optimizing how teams across the lifecycle work together. From our release of advanced production machine learning features in Cloudera Machine Learning, to releasing CDP Data Engineering for accelerating data pipeline curation and automation; our mission has been to constantly innovate at the leading edge of enterprise data and analytics. Adding to these innovations, we most recently released CDP Data Visualization (DV) — A native visualization tool built from our acquisition of Arcadia Data that augments data exploration and analytics across the lifecycle to more effectively share insights across the business.

Accelerate Collaboration Across The Lifecycle
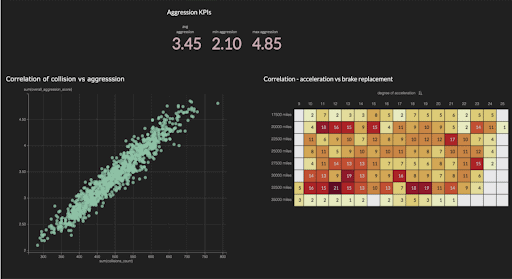
Included with CDP Data Warehouse and Machine Learning, DV enables data engineers, data scientists, business analysts, and business users to create and share important insights instantly across any team using an intuitive drag-and-drop interface. DV gives everyone across the data lifecycle the ability to present data analytics and machine learning models in meaningful ways. Users can collaborate across teams and share insights everywhere to reach business teams and decision-makers more effectively. CDP Data Visualization solves for the last-mile needs of making data actionable — enabling secure collaboration and transparency between data, analytics, and business teams without creating silos or moving data to third party platforms for gleaning sharable insights.
Secure, Integrated Visualizations Native to CDP
There are many benefits to being native to the CDP platform. First and foremost, it provides out of the box functionality without additional integration efforts, moving data, or creating security issues. DV ships included with CDP Data Warehouse and Machine Learning, meaning there’s zero setup time and users can instantly start building sharable dashboards and applications from their data and analysis. This allows analytic teams to be more agile and reduce barriers to deliver insights to their peers and broader business teams.
More importantly, from a security and governance perspective, native integration with CDP means SSO for authentication and seamless integration with Cloudera Shared Data Experience (SDX) to manage user access and governance. With DV, users login with their CDP credentials and start analyzing data that they have access to. There’s no need to replicate policies across multiple tools, and CDP enables agile, centrally governed data access which DV inherits automatically. Similarly, by tapping into CDP directly through DV there is no movement of data outside the purview of CDP. Keeping data in a central place avoids data leaks and strengthens security and governance throughout.
Data sources across the lifecycle
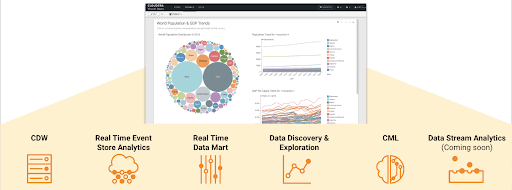
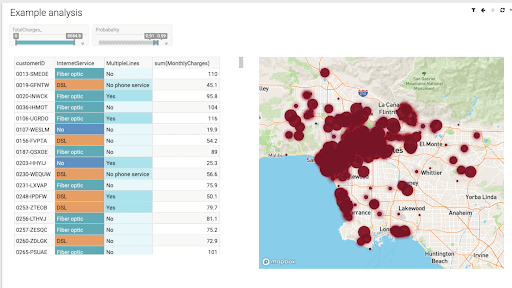
Data comes in different forms and speeds, that’s why CDP offers the right mechanisms to ingest, store, and query based on the characteristics of data. Apache Nifi and Apache Flink provide streaming ingest and processing framework, while Hive LLAP and Impala provide analytic engines for warehousing. And for text and unstructured data, Solr can help index and query them and Hbase can power real-time applications. That’s why Data Visualization has been designed to bring together and drive augmented analytics by surfacing visual analytics across all these sources of data. In a single dashboard or application, users can bring in a pie chart from a DW, a table showing results of a faceted search from Solr collection, and prediction results from a deployed ML model. Additionally, because Data Visualization is built on CDP, data can be accessed across any public cloud, on-premises, or hybrid cloud deployment easily.

CDP Data Visualization Connects All Your Data Across the CDP Ecosystem
Share Business-Critical Insights And ML-Powered Predictions Across Your Enterprise
CDP Data Visualization enables your business to quickly and effectively build business-critical dashboards and applications that accelerate collaboration and insight sharing everywhere. For data science and machine learning teams, DV offers the unique ability to build explainable predictive applications with models that have been deployed and are being served in Cloudera Machine Learning.

This means business users and decision-makers can more effectively understand how machine learning models work, to effectively ask predictive questions in their dashboards and apps. This capability, coupled with CDP’s integrated approach to enabling and accelerating the data lifecycle means your business can make faster, more trustworthy decisions from data everywhere.
To learn more about CDP Data Visualization and how it can serve your business, register for our Introducing Self-Service Data Visualization On Cloudera Data Platform webinar.


