How to Use Real-Time Data for Excel Financial Forecasting

New York Yankees legend Yogi Berra famously said, “If you don’t know where you are going, you’ll end up someplace else.” Good financial planning begins with good forecasting. Excel makes the process relatively easy, provided that you have easy access to your data on past results, current balances, and future projections.
There are many different types and models of forecasts that you may wish to create, depending on the nature of your business. Sales forecasts are among the most common, as most businesses are seeing fluctuating revenue and fluctuation in sales due to the current crisis situation. Let’s look at some ways that you might create a sales forecast using Excel along with real-time data from your ERP and CRM systems.
Starting Simple: Forecasting Based on Sales History
The simplest approach is to begin with a two-column series. Let’s assume that column “A” is a series of dates, and column “B” shows your weekly sales year-to-date. First, highlight the data in those two columns. From the Data menu in Excel, choose “Forecast Sheet”, and you’ll be presented with a graph that shows past sales and projected future sales.
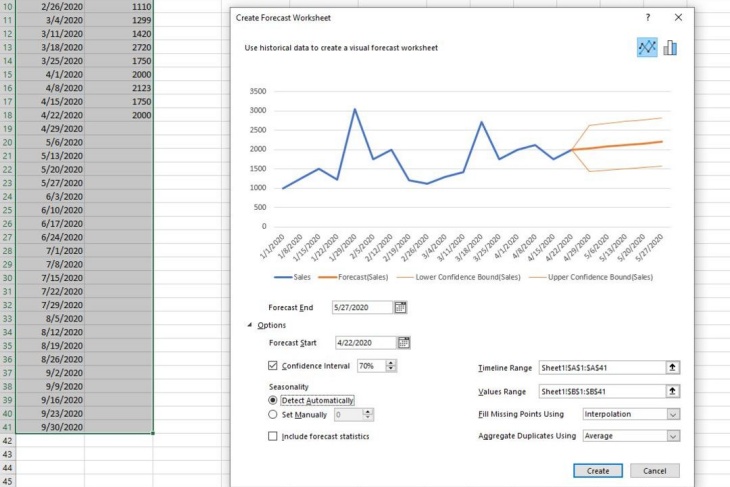
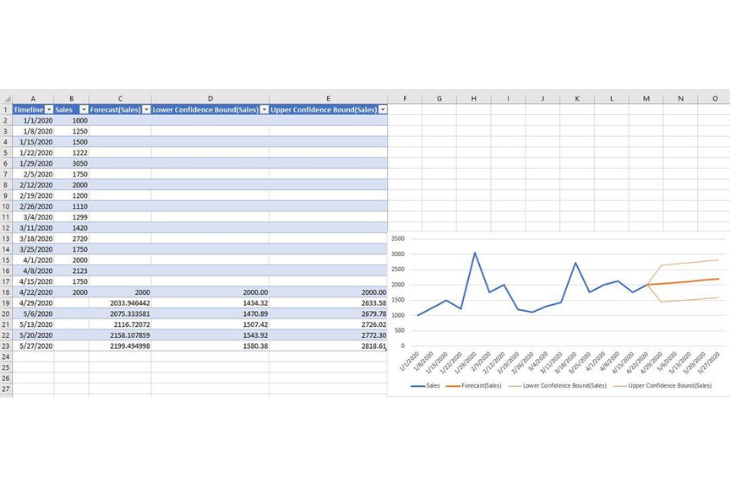
Click on “Options” (just below the graph) and you’ll be able to adjust some of the variables that drive the forecast calculations. Finally, click the “Create” button, and Excel will generate a new worksheet that shows you forecasted sales, along with an upper-bound (optimistic) projection and a lower-bound (pessimistic) projection.
Getting Real-Time: Connecting to your ERP and CRM
Now that you have the basics in place, let’s look at how you can incorporate sales and pipeline data. Real-time links to your source data can update your forecast as soon as new information becomes available. There’s no need to copy and paste information, which is not only tedious, but also likely to introduce errors into your forecast.
For many companies, sales data lives in the ERP system and pipeline lives in a separate CRM database. Getting that data to show up in Excel is easy if you’re using a product that is purpose-designed with ERP software in mind. (A range of such tools are available from insightsoftware, which integrates with over 140 different ERP systems and allow you to connect your ERP tool with Excel.)
Let’s go back to your simple sales forecast and imagine what it might look like with real-time data links. You could start with a column that pulls weekly sales totals directly from the ERP system. This gives you the same picture you had before, but instead of keying it manually (or copying and pasting), it comes directly from the ERP software. If anything changes (for example, if an adjusting entry was made to last week’s numbers), it will be updated automatically in the Excel forecast.
In the next column, you can add a weighted pipeline projection. For many companies, that might require you to link to a standalone CRM system.
Finally, you would perform a forecast based on past sales, and you have a simple way of validating the forecast against your pipeline. This is especially helpful in understanding whether your statistical forecast (provided by Excel) is supported by the pipeline numbers coming from your sales team.
Other Types of Forecasts
While sales forecasting provides one very important piece of the puzzle, there are many ways to apply these principles. Cash flow is the lifeblood of every business, so it’s critical to understand what the cash situation will look like in the coming weeks and months. By combining real-time links to cash balances, accounts receivable, payables, and forecasted revenue and expenses, Excel users can build a model for inflows and outflows that are automatically updated as conditions throughout the business change.
A more sophisticated approach is the “3 statement model,” which provides a single forecast linking the income statement, balance sheet, and cash flow statement into a single financial model. A well-formulated 3 statement forecast using real-time links can give you clear, up-to-date visibility to future financial conditions within your organization at all times.
Bringing Simplicity to a Complicated World
Purpose-built software tools can make it significantly easier to build reports that are accurate and easy to maintain.
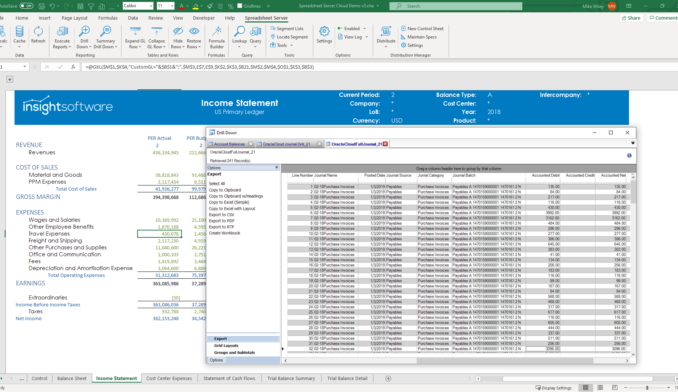
With the 3 statement model (or with any forecast that links to general ledger data), it’s especially useful to be able to add references that summarize your account balances based on account segments, departments, or ranges of accounts. Sophisticated tools offered by insightsoftware such as Bizview enable users to pull summary totals from a range of GL accounts using wildcards.
Let’s look at an example. If your GL account numbers include a segment that designates the product division, and another that specifies geography, you might like to create a single cell reference that pulls all of your revenue accounts between 41000 and 42999, but only for product lines in the 100-199 range, and only for geography 40. Your cell reference might look something like this: “[1??]–[41000-42999]-40”.
The magic of this approach is that it automatically pulls from your GL based on the ranges specified, even if you add new accounts. This mitigates the problem of having to reformat reports whenever a new general ledger account is added.
The right software tools will be able to address these kinds of sophisticated finance and accounting needs. Another example is a multi‑company statement that pulls from multiple disconnected ERP systems. This is a common scenario with subsidiaries, international divisions, or mergers and acquisitions.

Keeping Your Data Secure
Finally, you’ll want to save your forecast in a safe place and distribute it to the right people. Unfortunately, most of the Excel files produced by finance and accounting professionals are stored on local hard drives, where they are vulnerable to theft or loss. It’s important to store data in a central location with adequate security and backup.
Distribution of forecast data can likewise be a security concern. It may be easiest to develop your forecast in a single location, but you don’t necessarily want your department heads to see data from the entire organization. Look for technology tools that will support limited distribution, sending numeric values without providing real-time links, for example, or converting forecasts to PDF before distributing them.
Forecasts Are Always Wrong . . . But Useful
It is often said that all forecasts are wrong, but they are nevertheless very useful. Good planning starts with realistic expectations. Microsoft Excel provides a familiar, powerful tool for bringing your organization’s data to life and gaining insights that help guide your company’s management. When combined with tools that link to your enterprise data in real-time, Excel-based budgeting and forecasting planning can be the difference that helps you see the road ahead clearly and adjust course in time to avoid obstacles.
4 Things to Look for in a Financial Planning Solution
View Whitepaper NowRelated Resources

2019 Dresner Advisory Services

UI for BI: Designing High-Impact Dashboards


Management Report