Error Metrics: How to Evaluate Your Forecasts
When considering the performance of any forecasting model, the prediction values it produces must be evaluated. This is done by calculating suitable error metrics. An error metric is a way to quantify the performance of a model and provides a way for the forecaster to quantitatively compare different models1. They give us a way to more objectively gauge how well the model executes its tasks.
In this blog post we will cover some commonly used metrics for time series forecasting, how to interpret them, as well as the limitations of each metric. A friendly warning: This involves some math, which is necessary to explain how these metrics work. But the interpretation and limitations are clearly marked, so you can skip directly to the marked sections below the equations for straightforward explanations.
Mean Absolute Error (MAE)
MAE is defined as the average of absolute difference between forecasted values and true values.
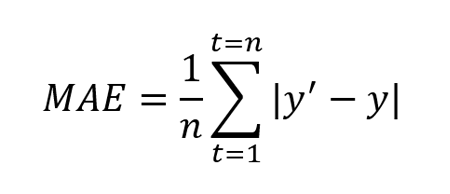
Where y’ is forecasted value and y is the true value. n is total number of values in the test set. MAE tells us how big of an error we can expect from the forecast on an average2. The error values are in the original units of forecasted values and MAE = 0 indicates that there is no error in the forecasted values.
The lower the MAE value, the better the model is; a value of zero means there is no error in the forecast. In other words, when comparing multiple models, the model with the lowest MAE is considered better.
However, MAE does not indicate the relative size of the error and it becomes difficult to differentiate big errors from small errors. It can be used with other metrics (see Root Mean Square Error below) to determine if the errors are larger. Additionally, MAE can gloss over problems to do with low data volume; see the last two metrics in this article to address that issue.

Mean Absolute Percentage Error (MAPE)
MAPE is defined as the percentage of the average of absolute difference between forecasted values and true values, divided by true value.
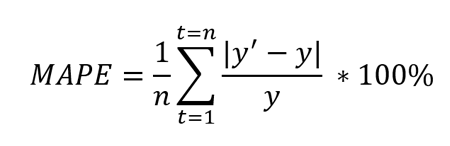
Where y’ is forecasted value and y is the true value. n is total number of values in the test set. Because of the in denominator, it works best with data without zeros and extreme values. If this value is extremely small or large, the MAPE value also takes an extreme value.
The lower the MAPE, the better the model is. Keep in mind that MAPE works best with data without zeros and extreme values. Like MAE, MAPE also understates the impact of large but infrequent errors due to extreme values. To deal with this problem, Mean Square Error can be used. This metric can gloss over problems to do with low data volume; see the last two metrics in this article to deal with that situation.
Mean Squared Error (MSE)
MSE is defined as the average of squares of the error3. It is also defined as the metric that assesses the quality of forecasting model or predictor. MSE also incorporates both the variance (the spread of predicted values from each other) and bias (the distance of predicted value from its true value).
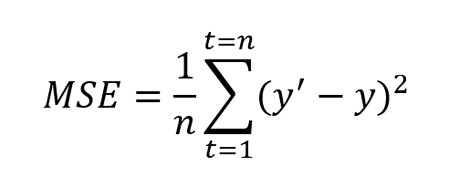
Where y’ is forecasted value and y is the true value. n is total number of values in the test set. MSE is almost always positive and values closer to zero are better. Because of the square term (as seen in the formula above), this metric penalizes large errors or outliers more compared to the small errors.
The closer to zero MSE is, the better. While it solves the extreme value and zero problem of MAE and MAPE, it might be disadvantageous in some cases. This metric can overlook issues when dealing with low data volume; see Weighted Absolute Percentage Error and Weighted Mean Absolute Percentage Error to deal with that.
Root Mean Squared Error (RMSE)
This metric is an extension of MSE and is defined as the square root of mean square error.
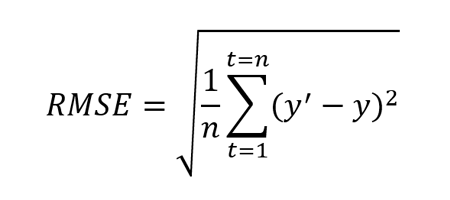
Where y’ is forecasted value and y is the true value. n is total number of values in the test set. Like MSE, this metric also penalizes larger errors more.
This metric is also always positive and lower values are better. One advantage of this calculation is that the RMSE value is in the same unit as the forecasted value. This makes it easier to understand compared to MSE.
RMSE can also be compared to MAE to determine whether the forecast contains large but infrequent errors. The larger the difference between RMSE and MAE the more inconsistent the error size.2 This metric can gloss over problems to do with low data volume; see the last two metrics in this article to address that issue.
Normalized Root Mean Squared Error (NRMSE)
NRMSE is an extension of RMSE and is calculated by normalizing RMSE. There are two popular methods for normalizing RMSE: using mean or using the range of the true values (difference of minimum and maximum values).
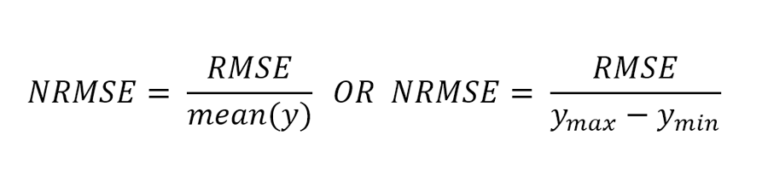
Where ymax is the maximum true value and ymin is the minimum true value.
NRMSE is often used to compare different datasets or forecasting models that have different scales (units and gross revenue, for example). The smaller the value is, the better the performance of the model. This metric can overlook issues when dealing with low data volume; see Weighted Absolute Percentage Error and Weighted Mean Absolute Percentage Error to address this.
Weighted Absolute Percentage Error (WAPE)
WAPE is defined as the weighted average of the mean absolute error.
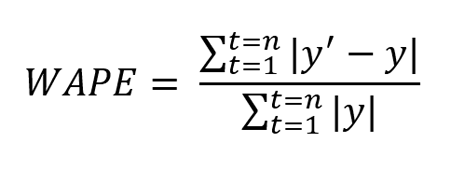
Where y’ is forecasted value and y is the true value. n is total number of values in the test set.
The error metrics mentioned above help us measure the performance of the forecasting model but can be deceiving when dealing with low volume data, for example, when the true value of some data points is very small compared to the rest of the data (e.g., intermittent demand/sales data). For such cases, WAPE can be used.
The lower the value of WAPE, the better the performance of the model. WAPE is helpful here because the “weighing” helps distinguish the smaller errors from larger errors. In other words, this metric prevents the small values from being considered as equal to or higher than larger values.4
Weighted Mean Absolute Percentage Error (WMAPE)
WMAPE is an extension of WAPE and is defined as the weighted mean absolute percentage error.
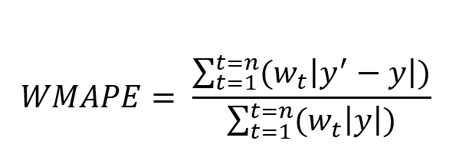
Where y’ is forecasted value and y is the true value. n is total number of values in the test set.
The lower the value of WMAPE, the better the performance of the model. This metric is helpful for low volume data where each observation has different priority when evaluating forecasting models. Observations with higher priority have a higher weight value. The larger the error in high priority forecast values, the larger the WMAPE value is.
Range of Errors & Accuracies
When using the error metrics mentioned above, the actual distribution of the error values is not known. However, this distribution can give further insights into the behavior of the forecasting model and help select the most suitable metric. In the Jedox AIssisted™ Planning Wizard, besides the aforementioned metrics, error distribution is also calculated, i.e., the value of the metric for each data point of the test set. A summary of the distribution, including other relevant values such as the minimum, maximum and median error values, is also provided.
Conclusion
Even though there are multiple metrics, each one provides specific information that may or may not be suitable for your specific use case. This means a metric should be chosen based on the use case and an understanding of the data involved in making the predictions.
Overview error metrics for forecasts
- MAE is useful when absolute error needs to be measured. It is easy to understand but it is not efficient when data has extreme values.
- MAPE is also easy to understand and is used when different forecast models or datasets need to be compared because this is a percentage value. MAPE suffers from the same disadvantage as MAE, i.e., it is not efficient when data has extreme values.
- MSE is useful when spread of the forecast values is important and larger values need to be penalized. However, this metrics is often difficult to interpret because it is a squared value.
- RMSE (NRMSE) is also useful when spread is of importance and larger values need to be penalized. RMSE is easier to interpret when compared to MSE because the RMSE value is of the same scale as the forecasted values.
- WAPE is useful when dealing with low volume data as it is calculated by weighting the error over total true values.
- WMAPE is also useful when dealing with low volume data. WMAPE helps to incorporate the priority by utilizing the weight (priority value) of each observation.
Jedox provides a comprehensive overview of forecast errors and their distribution in the AIssisted™ Planning Wizard, and also an unbiased view into the future with predictive forecasting.
References
1 Error Metrics
2 Absolute Error Forecast Accuracy
3 Mean Squared Error
4 MAPE vs. WAPE (DE)