Over the past couple years several Machine Learning (ML) capabilities have made their way into Oracle Analytics Cloud (OAC). If you are using OBIEE or OAC and wanting to apply ML to your data, there is no need to look for an additional software to do that. There are several ways in which ML capabilities can be leveraged out of the box with Oracle Analytics Cloud (OAC). I am not referring here to the decade old Oracle Advanced Analytics database option, which while very powerful, yet requires offline modeling and integration. The new OAC capabilities are built-in to the reporting platform and are accessible through either a browser or a desktop application and can be easily used by analysts. Below is an overview of what these methods are and how to apply them:
1. Advanced Analytical Functions and R Packages
OAC has built-in Advanced Analytical functions that are readily available to apply on data visualizations at the click of a button. These are accessible from Data Visualization under the Advanced Analytics tab on the left. In there, you will see the following functions:
- Trendline
- Cluster
- Outlier
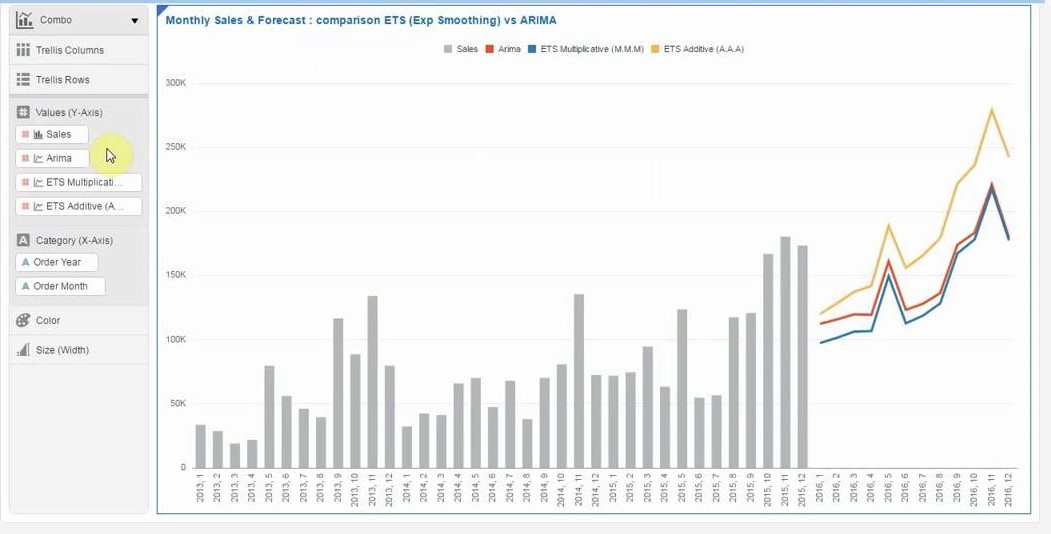
- Forecast
- Evaluate Script: While the above functions are pretty straightforward to apply to visuals, one doesn’t have to be restricted to them. We can upload any R package script to the server and use it on reports using the Evaluate Script function. Once the script is in place, using it on various reports together with rest of the data model becomes an easy task.

Guide to Oracle Cloud: 5 Steps to Ensure a Successful Move to the Cloud
Explore key considerations, integrating the cloud with legacy applications and challenges of current cloud implementations.
2. Built in Explain Capability
In addition to the built-in functions under Advanced Analytics, there is a fairly new feature in Data Visualization called “Explain” that is also accessible at the click of a button. To run Explain, simply right-click on an attribute in a data set while in Data Visualization and select Explain. Some serious algorithm crunching happens behind the scenes and then you get a popup of the findings summarized in graphical and narrative form. The power of the Explain feature is that it informs you of insights that you haven’t been aware of. This is where data discovery is truly independent of user bias and input. For example, when applying Explain to “Customer Segment”, you do not chose to look at anomalies based on location, gender, income level, and perhaps a combination of these among other factors. The “machine” is who decides what factors make more sense to highlight in relation to Customer Segment. It is the machine that finds out the story that the data can tell. Humans can only guess and keep guessing and its true sometimes we guess right. But the algorithm is capable of looking at all different scenarios and combination of factors. So being able to get such insights about the data with minimal effort is extraordinary. A word of caution though: at the end of the day, the effectiveness of doing “Explain” is going to be as efficient as the data set is well defined and the platform has enough processing power. Even though we simply click a button to get an explanation of what may be going on, we need to be aware of what data set we are exploring and make sure it has the right facts before starting to discover. Here are some of the example we can get out of Explain: Are customers with a certain type of insurance in a certain region likely to renew their subscriptions? What products are not working well for certain groups of customers and how do we identify these groups? Targeted marketing campaigns can then be run to address customer retention in specific customer segments, hence reducing marketing cost while improving campaign effectiveness.
3. Train and Apply ML Models
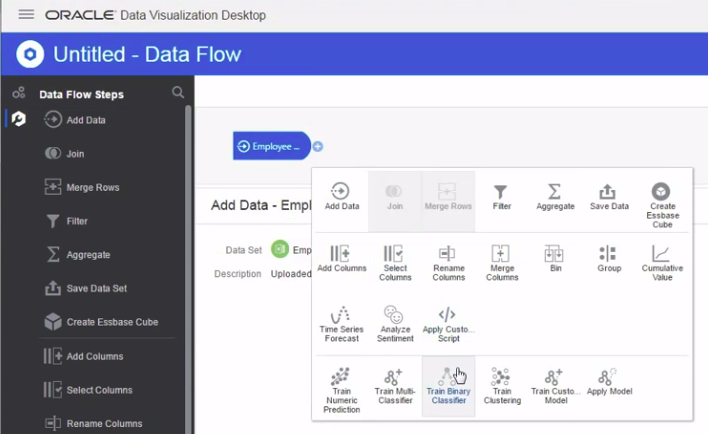
If you have seen how typically ML modeling works, this must be familiar. In OAC we can use Data Flows to create and train a model and then use that model in other data flows to apply to incoming data sets. In the simple use case, we create two data flows to do this:
a. The first Data Flow is to create and train the model based on a larger subset of the historical data. This is done by first selecting what attributes are to be fed into the model, and second choosing what type of ML algorithm to base the model upon. There are several built-in ML algorithms that can be applied with minimal knowledge as to what these models actually do as we train them. Some of these are: Neural Network Classification, Naive Bayes, Random Forecast and many others. Different models are suitable for different types of use cases, and there are input parameters for each model that you can update to best suit the characteristics of the data you are applying it to. You typically start with default parameters and with time, as you gain more interest and understanding of these models, you can then start adjusting the parameters to get outcomes with higher accuracy, hence the concept of training and scoring a model. This is the step that is more system processing resources intensive as the model gets trained.
b. The second Data Flow is where the model created in the first step gets applied to the remainder (smaller) subset of the historical data available for this purpose. Applying the model is less resource intensive (in machine processing power perspective). The result of this steps tells us how accurate the model is by applying it to a data set that wasn’t previously used to create the model. The idea is to iteratively re-train the model until we get good scores of precision and accuracy. And these scores are easily accessible by looking at the properties of the model after it has been generated.
Once we are satisfied with the outcomes the model is producing, we can then apply it against newer data sets and merge its results together with other OAC data elements on dashboards and in Data Visualization projects.
Interested to get an up-close look at these ML features? Please leave a comment and we’ll follow up with you.