Titanic Survival Prediction Using Machine Learning
This article was published as a part of the Data Science Blogathon
Hey Folks, in this article, we will be understanding, how to analyze and predict, whether a person, who had boarded the RMS Titanic has a chance of survival or not, using Machine Learning’s Logistic Regression model.
Brief description about Logistic Regression:
A simple yet crisp description of Logistic Description would be, “it is a supervised learning classification algorithm used to predict the probability of a target variable. The nature of target or dependent variable is dichotomous, which means there would be only two possible classes.” as stated in the tutorial points article.
The graph of logistic regression is as shown below:
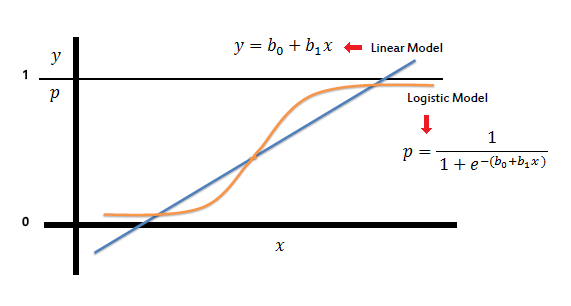
image source: link
Let’s Dive into the process..!! :
Now let us begin the main part of this article.
If you prefer an audio-visual understanding of this process, you can refer to this video below. It goes through everything in this article with a little more detail and will help make it easy for you to start programming your own machine-learning model, even if you don’t have python installed on your computer.
Or you can use both as supplementary materials for learning about machine learning!
For better understanding, let’s split the task into smaller parts and depict them in a workflow as shown below :
(image source is the video linked above: image_link )
.png)
As we now know what we have to do, to accomplish this task, we shall begin with the very first and the most important thing needed in machine learning, a Dataset.
What is a dataset:
A data set, as the name suggests, is a collection of data. In Machine Learning projects, we need a training data set. It is the actual data set used to train the model for performing various actions.
Here, in this case, we will be using a dataset available on the internet. One can find various such datasets over the internet.
The dataset that I’ve used in my code was the data available on Kaggle. You can also download it from here.
One thing must be kept in mind, the larger the data, the more we can train our model, and the more accurate our results come out to be. Don’t worry if all of this sounds weird to you, it will all make sense in a few minutes. 🙂
Let’s Begin with our Coding:
To code, as we know we need a suitable environment, here in my case I’ve used Google Colab, as it reduces the hectic task of compiling and running the program on your PC. You may use any editor as you like.
The foremost that we need to do is import the dependencies that we will be using in our code.
Importing dependencies :
We will be using: NumPy, pandas,matplotlib, seaborn,sklearn.
As we move ahead, you will get to know the use of each of these modules.
Now, we need to upload the downloaded dataset, into this program, so that our code can read the data and perform the necessary actions using it.
As we have downloaded a CSV file, we shall be using Pandas to store that data in a variable.
Our dataset is now stored in the variable named titanic_data.
To get a brief idea about how the data is loaded, we use the command “variable_name.head()” to get a glimpse of the dataset in the form of a table.
The output came out to be as follows:
.png)
The meaning of the values (SibSp, Parch) can be found on the website from which we have downloaded the dataset.
We have learned from Kaggle while downloading the data set, that the data has 891 rows and 12 columns.
Now, let’s check how many cells are left empty in the table.
titanic_data.isnull().sum()
The output came out to be as follows:
.png)
We cannot leave the cells empty, thus have to fill the tables with the most suitable values.
Handling the missing values:
Dropping the “Cabin” column from the data frame as it won’t be of much importance
titanic_data = titanic_data.drop(columns='Cabin', axis=1)
Replacing the missing values in the “Age” column with the mean value
titanic_data['Age'].fillna(titanic_data['Age'].mean(), inplace=True)
print(titanic_data['Embarked'].mode())
titanic_data['Embarked'].fillna(titanic_data['Embarked'].mode()[0], inplace=True)
Now let us check if there are still any cells remaining empty.
Running the isnull() command again, we get the satisfactory output, that no such empty cells are present.
We have already noticed from the table, there are two columns that contain string-type values: The “Sex” column and the “Berth” column.
Transformation into a categorical column.
Let’s convert that into integer type values, and transform it into a categorical column:
titanic_data.replace({'Sex':{'male':0,'female':1}, 'Embarked':{'S':0,'C':1,'Q':2}}, inplace=True)
Now if we run the titanic_data.head() command again, we find that the values have been replaced successfully.
We also see, that there are few columns, which are not of much importance in this process. Let us get rid of them.
titanic_data= titanic_data.drop(columns = ['PassengerId','Name','Ticket','Survived'],axis=1)
Now it’s time to begin implementing machine learning.
Let’s split the data into the target and feature variables.
X = titanic_data.drop(columns = ['PassengerId','Name','Ticket','Survived'],axis=1)
Y = titanic_data['Survived']
Here, X is the feature variable, containing all the features like Pclass, Age, Sex, Embarked, etc. excluding the Survived column.
Y, on the other hand, is the target variable, as that is the result that we want to determine,i.e, whether a person is alive.
Now, we will be splitting the data into four variables, namely, X_train, Y_train, X_test, Y_test.
X_train, X_test, Y_train, Y_test = train_test_split(X,Y, test_size=0.2, random_state=2)
Let’s understand the variables :
X_train: contains a set of values from variable ‘ X ‘
Y_train: contains the output (whether the person is alive or dead) of the corresponding value of X_train.
X_test: contains a set of values from variable ‘ X ‘, excluding the ones from X_train.
Y_train: contains the output (whether the person is alive or dead) of the corresponding value of X_test.
test_size: represents the percentage ratio of X_train:X_test (Here 0.2 means that the data will be segregated in the X_train and X_test variables in a 80:20 ratio). You can use any value you want. A value <0.3 is preferred
Logistic Regression :
Let’s create a model named model
model = LogisticRegression()
Now let us train the model, with our training values(X_train , Y_train)
model.fit(X_train, Y_train)
The model trains in a way like this: “When the values of X are these, the value of Y is this.”
Checking the Accuracy:
Checking the accuracy of when our model tries to predict the values, using our training data :
Let’s name a variable X_train_prediction, which will store all the predictive outputs of the values X_train.
X_train_prediction = model.predict(X_train)
Now, to check how accurate was its prediction, we compare the values of X_train_prediction with Y_train, which was the original real-life data.
training_data_accuracy = accuracy_score(Y_train, X_train_prediction)
print('Accuracy score of training data : ', training_data_accuracy)
The output comes out to be 0.8075842696629213, which is pretty decent.
Now, Let’s try it again with X_test and Y_test:
X_test_prediction = model.predict(X_test)
test_data_accuracy = accuracy_score(Y_test, X_test_prediction)
print('Accuracy score of test data : ', test_data_accuracy)
The output came out to be 0.7821229050279329, which was very close to our test data prediction.
Thus our model is quite accurate as per the data we received.
Checking for a Random Person:
Now let’s check for a random Person using random data from the unedited table from Kaggle.
input_data = (3,0,35,0,0,8.05,0) # Note that these datas exclude the Survived data, as it is to be determined from the model itself
Now let’s change these values to a NumPy array :
input_data_as_numpy_array = np.asarray(input_data)
As our model was trained in different dimensions, we need to reshape this to our target dimensions.
input_data_reshaped = input_data_as_numpy_array.reshape(1,-1)
Now, Let’s predict using our model:
prediction = model.predict(input_data_reshaped)
#print(prediction)
if prediction[0]==0:
    print("Dead")
if prediction[0]==1:
    print("Alive")
On running the code, we get the exact same result, as the given one, in the table.
Thus we can conclude that our model is performing well. You can train the model using a bigger dataset to get better results.
End Notes :
The result of any machine learning model can be made more precise using a bigger dataset, but, it will be much more tedious and time-consuming. Feel free to add any kind of necessary changes to this code, and customize it as per your requirements. A similar logic can be applied to perform various kinds of predictions.
Thanks for reading…Have a good day..!!
About the Author:
Heyy, I am Pinak Datta, currently, a second-year student, pursuing Computer Science Enginnering from Kalinga Institute of Industrial Technology. I love Web development, Competitive Coding, and a bit of Machine Learning too. Please feel free to connect with me through my socials.
The media shown in this article are not owned by Analytics Vidhya and are used at the Author’s discretion.


