Decluttering the performance measures of classification models
This article was published as a part of the Data Science Blogathon.
Introduction

There are so many performance evaluation measures when it comes to selecting a classification model that our brain can get tangled just like a thread ball during knitting! In this blog, my intention is to declutter and organize the several jargon used in classification problems from a binary classification point of view. Once the jargons are clear, we can use them in the most appropriate manner and we can knit the perfect classification model.
What are the Performance Evaluation Measures for Classification Models?
- Confusion Matrix
- Precision
- Recall/ Sensitivity
- Specificity
- F1-Score
- AUC & ROC Curve
Confusion Matrix:
Confusion Matrix usually causes a lot of confusion even in those who are using them regularly. Terms used in defining a confusion matrix are TP, TN, FP, and FN.
Use case: Let’s take an example of a patient who has gone to a doctor with certain symptoms. Since it’s the season of Covid, let’s assume that he went with fever, cough, throat ache, and cold. These are symptoms that can occur during any seasonal changes too. Hence, it is tricky for the doctor to do the right diagnosis.
True Positive (TP):
Let’s say the patient was actually suffering from Covid and on doing the required assessment, the doctor classified him as a Covid patient. This is called TP or True Positive. This is because the case is positive in real and at the same time the case was classified correctly. Now, the patient can be given appropriate treatment which means, the decision made by the doctor will have a positive effect on the patient and society.
False Positive (FP):
Let’s say the patient was not suffering from Covid and he was only showing symptoms of seasonal flu but the doctor diagnosed him with Covid. This is called FP or False Positive. This is because the case was actually negative but was falsely classified as positive. Now, the patient will end up getting admitted to the hospital or home and will be given treatment for Covid. This is an unnecessary inconvenience for him and others as he will get unwanted treatment and quarantine. This is called Type I Error.
True Negative (TN):
Let’s say the patient was not suffering from Covid and the doctor also gave him a clean chit. This is called TN or True Negative. This is because the case was actually negative and was also classified as negative which is the right thing to do. Now the patient will get treatment for his actual illness instead of taking Covid treatment.
False Negative (FN):
Let’s say the patient was suffering from Covid and the doctor did not diagnose him with Covid. This is called FN or False Negative as the case was actually positive but was falsely classified as negative. Now the patient will not get the right treatment and also he will spread the disease to others. This is a highly dangerous situation in this example. This is also called Type II Error.
Summary: In this particular example, both FN and FP are dangerous and the classification model which has the lowest FN and FP values needs to be chosen for implementation. But in case there is a tie between few models which score very similar when it comes to FP and FN, in this scenario the model with the least FN needs to be chosen. This is because we simply cannot afford to have FNs! The goal of the hospital would be to not let even one patient go undiagnosed (no FNs) even if some patients get diagnosed wrongly (FPs) and asked to go under quarantine and special care.
Here is how a confusion matrix looks like:
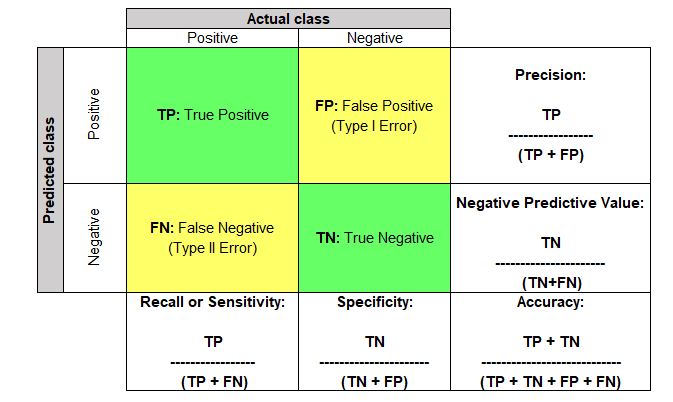
Accuracy:
Accuracy = (TP + TN) / (TP + FP +TN + FN)
This term tells us how many right classifications were made out of all the classifications. In other words, how many TPs and TNs were done out of TP + TN + FP + FNs. It tells the ratio of “True”s to the sum of “True”s and “False”s.
Use case: Out of all the patients who visited the doctor, how many were correctly diagnosed as Covid positive and Covid negative.
Precision:
Precision = TP / (TP + FP)
Out of all that were marked as positive, how many are actually truly positive.
Use case: Let’s take another example of a classification algorithm that marks emails as spam or not. Here, if emails that are of importance get marked as positive, then useful emails will end up going to the “Spam” folder, which is dangerous. Hence, the classification model which has the least FP value needs to be selected. In other words, a model that has the highest precision needs to be selected among all the models.
Recall or Sensitivity:
Recall = TP/ (TN + FN)
Out of all the actual real positive cases, how many were identified as positive.
Use case: Out of all the actual Covid patients who visited the doctor, how many were actually diagnosed as Covid positive. Hence, the classification model which has the least FN value needs to be selected. In other words, a model that has the highest recall value needs to be selected among all the models.
Specificity:
Specificity = TN/ (TN + FP)
Out of all the real negative cases, how many were identified as negative.
Use case: Out of all the non-Covid patients who visited the doctor, how many were diagnosed as non-Covid.
F1-Score:
F1 score = 2* (Precision * Recall) / (Precision + Recall)
As we saw above, sometimes we need to give weightage to FP and sometimes to FN. F1 score is a weighted average of Precision and Recall, which means there is equal importance given to FP and FN. This is a very useful metric compared to “Accuracy”. The problem with using accuracy is that if we have a highly imbalanced dataset for training (for example, a training dataset with 95% positive class and 5% negative class), the model will end up learning how to predict the positive class properly and will not learn how to identify the negative class. But the model will still have very high accuracy in the test dataset too as it will know how to identify the positives really well.
Use case: Let’s take an example where we must give equal importance to both the classes – classify an email as Spam and non-Spam. Let’s assume that the model was trained only a highly imbalanced training dataset. Here, Spam is “positive” and non-Spam is “negative” and the training dataset was 90% spam emails and 10% non-spam emails. A model with high accuracy will know to correctly identify all the spam emails but will have trouble identifying non-spam emails. Hence, a lot of important emails will end up going to the spam folder. But if we select a model that has a high F1 score, it would perform better in classifying non-spam from spam.
Area Under Curve (AUC) and ROC Curve:
AUC or Area Under Curve is used in conjecture with ROC Curve which is Receiver Operating Characteristics Curve. AUC is the area under the ROC Curve. So let’s first understand the ROC Curve.
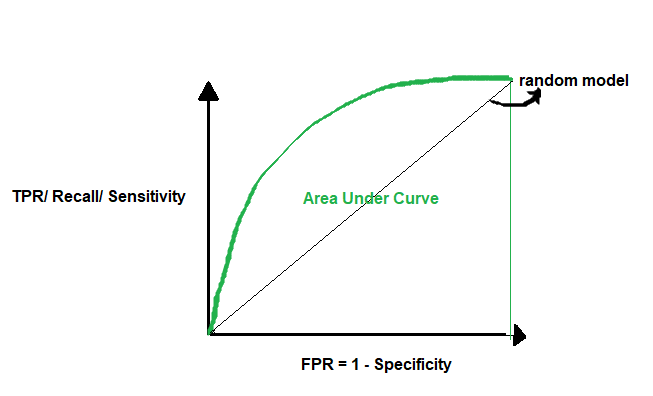
A ROC Curve is drawn by plotting TPR or True Positive Rate or Recall or Sensitivity (which we saw above) in the y-axis against FPR or False Positive Rate in the x-axis. FPR = 1- Specificity (which we saw above).
TPR = TP/ (TP + FN)
FPR = 1 – TN/ (TN+FP) = FP/ (TN + FP)
If we use a random model to classify, it has a 50% probability of classifying the positive and negative classes correctly. Here, the AUC = 0.5. A perfect model has a 100% probability of classifying the positive and negative classes correctly. Here, the AUC = 1. So when we want to select the best model, we want a model that is closest to the perfect model. In other words, a model with AUC close to 1. When we say a model has a high AUC score, it means the model’s ability to separate the classes is very high (high separability). This is a very important metric that should be checked while selecting a classification model.
Summary:
We have seen a various performance or evaluation measures that can be used to choose the best classification model. We also saw that depending upon the problem, we will use the appropriate metric. While accuracy is one of the widely used scores, in the case of imbalanced datasets, we will go for F1-score. Also, we saw the importance of selecting a model using the AUC value. I hope, this blog will help you knit a beautiful classification model that can make an almost perfect prediction. Good luck and thanks for reading!


The recall is written wrong in the text. It should be: Recall = TP / (TP+FN) = TP / {#observations in the positive class}
There is a typo in the formulae of Recall or Sensitivity. It should be TP / (TP + FN) .