Weekly, Monthly, Quarterly & Annual HR Report Templates To Empower Your Management

Table of Contents
3) HR Reporting Examples & Templates
4) Why Do You Need HR Reporting?
Whether you realize it or not, your human resources (HR) department is one of the most pivotal sectors within your business. If managed strategically, your HR department could enhance your business in a number of ways. Moreover, interactive HR dashboard templates offer businesses the means to understand their personnel better, spot emerging problems or issues, and deploy proactive solutions to manage their HR departments in a more fluent, result-driven fashion.
Furthermore, frequent reporting through HR analytics tools helps companies uphold their culture, attract and retain employees, and provide them with invaluable knowledge while offering the astute ability to perform at their best potential.
Part of being an effective, data-driven organization in today’s hyper-connected digital world is the intelligent application of data analytics through integrated, HR-focused BI dashboards. By leveraging HR KPIs, which are measurements that enable businesses to track very specific areas of HR-related data, companies like yours can continuously and consistently improve their HR capabilities.
No matter the size of a company, reports for management as well as team members are a critical part of any business that wants to achieve a competitive advantage in our cutthroat market.
That said, in this article, we consider what HR reports are and what they do and explore their value in the modern age with the help of professional dashboards. You’ll not only gain a comprehensive insight into the workings of HR analytics reports, but you’ll gain a deeper understanding of HR data-driven online dashboards in a real-world business context.
What Is An HR Report?
Fundamentally, an HR report is an analytical method used to display human resources-related stats, insights, and metrics with the primary purpose of improving workforce performance, recruiting procedures, and other relevant HR processes with the help of HR dashboards.
There are various KPI examples, but by working with HR-driven metrics, it’s possible to spot trends, identify inefficiencies, capitalize on strengths, and fortify weaknesses in a number of key areas, making your HR efforts, activities, and initiatives the best they can possibly be for departments across the organization.
HR is becoming increasingly important, and the reporting part is crucial not only in helping professionals to extract the best possible insights but also in automating processes that were traditionally performed manually. To put things into perspective, we will focus on the main types of HR reports that look into data from different angles and tell a specific HR narrative that is created with a modern dashboard designer.
What Are The Different Types Of HR Reports?
As mentioned, HR is dealing with various business angles that ultimately help in successfully managing personnel and increasing workforce value. A recruiting report will focus on external and/or internal candidates, while talent management will bring analysis into the ways an organization deals with and manages current employees and talents. Here, we will cover a few of these different types of human resources reports.
- Employee information report: One of the most straightforward but fundamental types covered here is employee information reports. These documents provide the HR team with all the administrative data regarding the company’s workforce. This includes relevant information that is also contained in the other types that we will mention in this section, such as employee demographics, the headcount of active employees, revenue, male-to-female ratios, and satisfaction rates, among other things. These insights allow managers to compare the data across different departments and get a detailed overview of general workforce management across the entire organization.
- Recruitment report: As its name suggests, this document allows HR managers to track every detail related to their hiring and recruiting processes. They can include fundamental metrics such as the average time to hire, the costs per hire, or even how diverse is the recruiting process. It is important to keep track of these details as they can help you optimize your recruiting strategies and speed up the process of finding the best candidates for each open position quickly. We will take a look at an interactive example of this type of tool later in the post.
- HR performance management report: Monitoring employee performance is a fundamental task of any HR manager as it provides the needed insights to ensure the business works at its best capacity. To assist in that process, HR management reports provide fundamental metrics to understand how your workforce is performing and spot any improvement opportunities, such as lack of training or assistance. Some of the indicators you can find on these types of reports include the time to productivity, peer reviews, number of hours worked, and training costs, among others. Employee performance can be tracked on a departmental, team, or individual level. For example, if sales are dropping, HR might analyze the development of the sales team to understand if something is lacking there.
- Attendance and absenteeism report: This next type is directly related to the one we just discussed above - since attendance or absenteeism can directly affect productivity. Tracking how much absence is happening, when it is happening, and what is causing it to happen is a very important step not only to ensure optimal productivity but also to make sure your workforce is happy. For instance, you can observe that the absenteeism rate is related to stress which is something that needs to be tackled immediately by providing support to whoever needs it. On the other hand, tracking these rates can also help you forecast the average costs of absence, which can be monetary on paid leaves or a loss in general productivity.
- Diversity report: Hiring a diverse workforce has become fundamental in today’s organizational landscape. Nowadays, more and more companies are ensuring to hire diverse workers not only to stay compliant with regulations but also because of the value that a diverse environment can bring to an organization. For that purpose, a diversity report allows HR managers to monitor how diverse their organization is in areas such as gender, race, and disabilities. With this tool, they can find answers to questions like are our managerial positions diverse enough? Are our diverse employees happy with the company? Are we providing the same opportunities to all of your workforce?
- Turnover and retention report: Employee satisfaction should be a priority for any organization. In the end, it is our workforce who will move the business forward. Therefore, it is important to ensure we provide them with the best environment and opportunities to keep them satisfied. On that note, a turnover and retention report is a document that tracks how many employees have left their positions as well as the costs associated with them leaving or the efforts to retain them. These costs can include anything from loss in productivity as well as replacement. Paired with this, by looking at the turnover rates, you can also spot internal issues that can be addressed to improve satisfaction and retention rates.
- Salary and compensation reports: While it might seem like all salary-related information concerns the financial department, it is also fundamental information that the HR team needs to manage. These reports include all salary information as well as any other compensation provided by the company, such as insurance, pension plans, and bonuses, among others. Having this information in hand allows the HR department to make informed decisions when it comes to salary negotiations, resource allocations, paid leaves, as well as the implementation of different incentives for employees.
Now that we have a clear understanding of the different types of reports, we will cover how they can be tracked in different periods for different purposes.
We offer a 14-day free trial. Start creating great HR reports today!
HR Analytics Examples For Weekly, Monthly, Quarterly & Annual Reporting
We mentioned the main areas in which HR performance statements can benefit businesses. As mentioned, these analytical tools can also be based on different periods. For instance, an HR weekly report will show more short-term goals and metrics, while the annual one will consider broader strategies. The point is to successfully consolidate all the data that HR professionals need to collect and create the best possible HR management processes. To help you in the process, modern KPI software can help in uncovering critical issues, save time, and, ultimately, reduce costs to make this process as efficient as possible.
To put this into perspective, here we will cover some of the types we just mentioned above, with the help of modern HR dashboard examples for annual, quarterly, monthly, and weekly HR analytics.
1. Annual HR Report Templates and KPIs
HR annual reports enable companies to evaluate human resources activities that affect their performance each year to drive competitive strategies and determine if action needs to be taken in your HR environment to increase the dynamics of HR development. The above-mentioned human resources report template can also be utilized for annual monitoring needs. However, we have additional templates to enhance the HR annual requirements.
a) Employee Performance Dashboard
As mentioned, your workforce is integral to the ongoing success of your organization, and it’s up to your HR department to help encourage and optimize employee productivity on a continual basis.

**click to enlarge**
This particular template helps to form a visual narrative of key performance elements such as absenteeism, overtime, training costs, and overall employee productivity rates throughout the organization. In turn, this employee management sample provides a perfect storm of information for keeping your business as productive as humanly possible. This annual HR report example drills down into important elements of the workforce and its structure in a host of key areas.
These are the KPIs linked to this particular template:
- Absenteeism rate: The example above displays employee performance. This enables businesses to measure the engagement level of employees and is an important KPI because it indicates an employee’s level of motivation and engagement with his or her work and the company as a whole. Organizations should keep a close eye on this metric and must always attempt to reduce the number because of the impact on productivity. Companies can determine the reason behind employee absenteeism rates over the past month to see if it’s unique to a certain department or if it’s a widespread issue throughout the entire organization.
- Overtime hours: This enables organizations to track employee workloads in greater detail and shows employee dedication as well as work process flaws. This metric directly affects the absenteeism rate metric, and a permanent high workload is sure to reduce employee satisfaction levels, which can result in an increase in absenteeism rates. Permanently high overtime can limit the company’s growth potential while resulting in missing projects or orders.
- Training costs: These metrics are used to calculate the investment that has gone towards onboarding new hires and upgrading the skill level of the employees. It tracks employee development costs and new skill requirements. Training costs are not limited to new hires and extend to better job development skills and continuous learning.
- Employee productivity: This determines the effectiveness of your labor force which is calculated by dividing the total sales by the number of employees. Components that factor into this metric include availability and the number of hours they work, employee performance, the number of products delivered, and the quality of saleable products produced during a set period. Productivity metrics enable companies to understand employee performance and adjust working processes where applicable. You can see a visual example below:
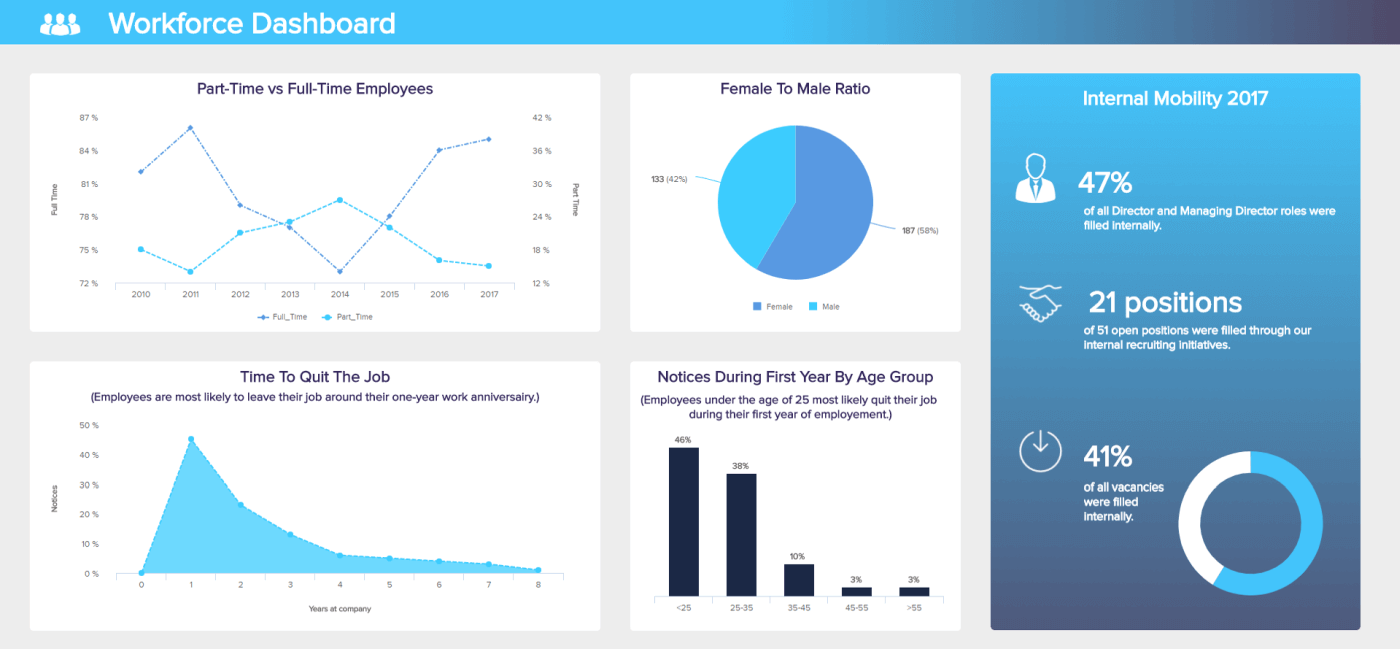
b) Annual Workforce Dashboard
This particular one of our sample HR reports for management explores general workforce-based metrics that will help you grow, evolve, and develop over time through smarter, more data-driven employee management:
**click to enlarge**
The insights served up by this HR annual report template will offer a level of insight that will improve the way you engage your employees, help you better reward good work, save costs in critical areas, and encourage employee loyalty – all of the key ingredients of a successful business.
Here are the primary KPIs associated with this example:
- Part-time employees: indicates the evolution of part-time workers over a specified period. Part-time workers are good for the beginning stages of companies and don’t acquire much risk. KPIs include the tracking of part-time contracts parallel to metrics like overall performance and results, as well as employee satisfaction and engagement.
- Female to male ratio: measures the level of gender diversity in your business, which can indicate gender bias. It’s critical to be aware of diversity to acquire differing approaches to business innovation and gain competitive assets. KPIs depend on candidate availability at certain times.
- Internal mobility: internal mobility refers to every initiative or action related to the promotion, appointment, or hire for a position of an employee already enrolled in the company’s workforce. This internal mobility summary displays various figures related to it – promotions to the position of director and managing director, the ratio of positions filled through internal initiatives relative to the total positions, and finally – the percentage of vacancies filled internally.
- Average time stay: indicates the longest period workers stay with the company and if it is good at retaining them. The metric tracks the average number of weeks, months, or years that an employee stays. The longer the stay, the better the company’s return on investments for hiring and training. An example generated with a professional KPI tool can be seen below.

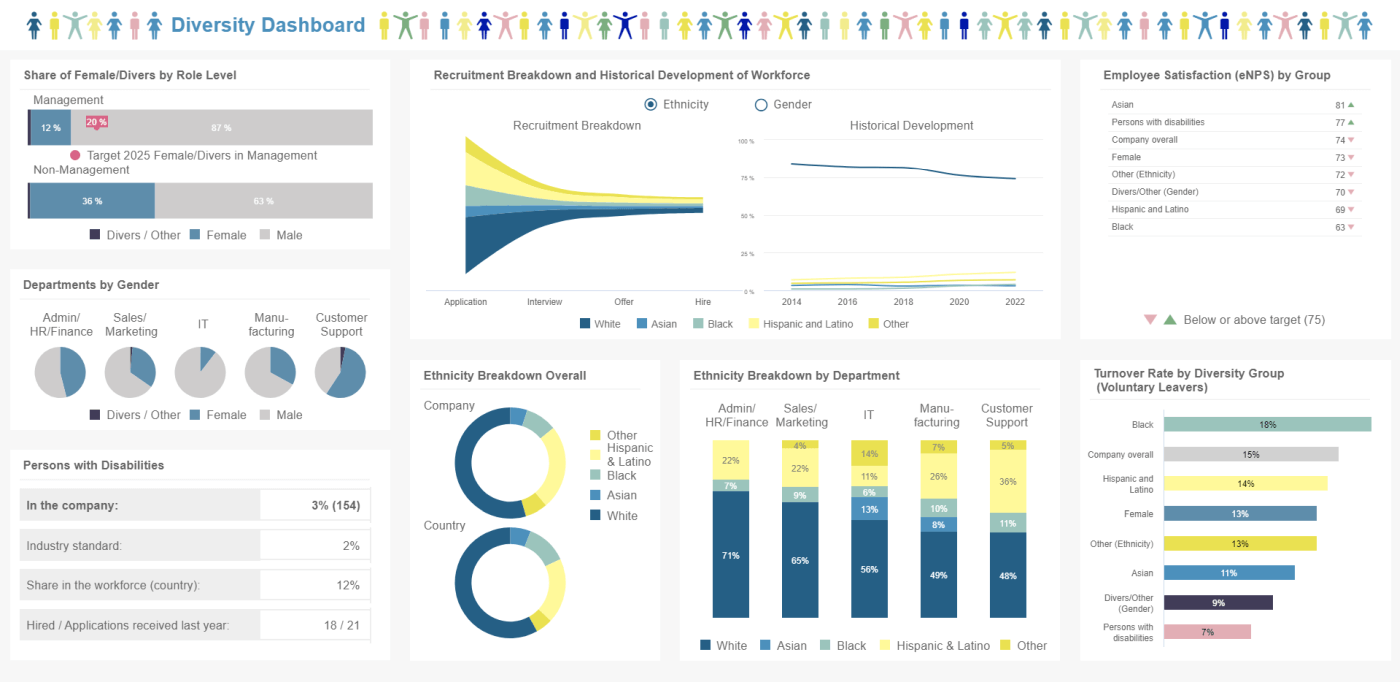
c) Annual Diversity Dashboard
Our next example is an annual diversity dashboard generated with modern BI dashboard software with fundamental indicators to help HR managers ensure that the organization is hiring a diverse workforce as well as keeping them happy by providing equal opportunities as other employees.
**click to enlarge**
Every day, more and more companies are realizing the value of merging different perspectives and backgrounds into one group of innovative and creative people. That said, even though the value of a diverse workforce is undeniable, it still presents a challenge for some organizations, especially when it comes to higher-paid positions. To help HR managers be on the right track with their diversity measures, this dashboard is the perfect tool. Let’s look at it in more detail.
- Share of female/diverse by role level: This straightforward KPI tracks the share of female or diverse employees that are working in managerial positions. It is no secret that higher-paid positions are usually occupied by white males. That said, regarding diversity in the workplace, HR managers need to ensure this happens at all levels of the organization. Therefore, this organization has set a target of increasing female or diverse workers in managerial positions to 20% by 2025.
- Recruitment by ethnicity/gender: As its name suggests, this KPI tracks the diversity of the recruitment strategy. In this case, the KPI is divided into stages of the recruiting process to understand the share of diverse applicants that actually turn into hired employees. A great way to avoid bias is to set diversity measures such as standardized interviews or use anonymous resumes to select candidates.
- Ethnicity by department: Following on the same line as the previous indicators, ethnicity and gender by department provide insights into how diverse each department is. As mentioned before, some companies might be diverse but are still biased in some departments, such as hiring men for manufacturing or IT positions or white people for administration positions. Therefore, this is an important indicator to track.
- Diversity group eNPS: The eNPS, also known as employee satisfaction, is an indicator used by HR managers to evaluate how happy their workers are with the organization. In this case, the eNPS is divided by diversity groups and compared to a target of 75. Unfortunately, various groups are under this target. Therefore, it needs to be looked into to ensure a great environment for everyone.
- Turnover rate by diversity group: Directly related to the eNPS, the turnover rate by diversity group tells the HR team the percentage of voluntary leaves by diversity group. It allows them to understand if a specific group is unsatisfied with the organization. In this case, we can see that the rate for black workers is higher than the overall business rate. This is a concerning number that needs to be looked into to find reasons and implement solutions immediately.
d) Annual HR Report Metrics Examples
We’ve explored the practical workings of annual HR reports for management. Now we will look at metrics that can further boost your year-on-year HR-based activities.
These cost-related metrics can also be used for annual HR analysis reports to show to top management and the financial department:
Compensation:
- Labor cost per FTE: the average expense of labor that a business spends for each FTE annually.
- Labor cost revenue percent: the total labor cost as a percentage of the annual organization's revenue.
- Labor cost expense percentage: the total labor cost as a percentage of the total annual expenses.
- Benefits as a percentage of labor costs: the total cost of benefits as a percentage of the total annual labor costs.
2. HR Quarterly Report Example For Executives
Quarterly reports provide an up-to-date overview of HR operations to help make important decisions that can’t wait until the year is completed. It helps HR executives and decision-makers ensure resources are being allocated smartly and identify areas where improvements are needed. To put the power of these analytical tools into perspective, below, we’ll provide a quarterly HR report example with a focus on high-level metrics for executives.
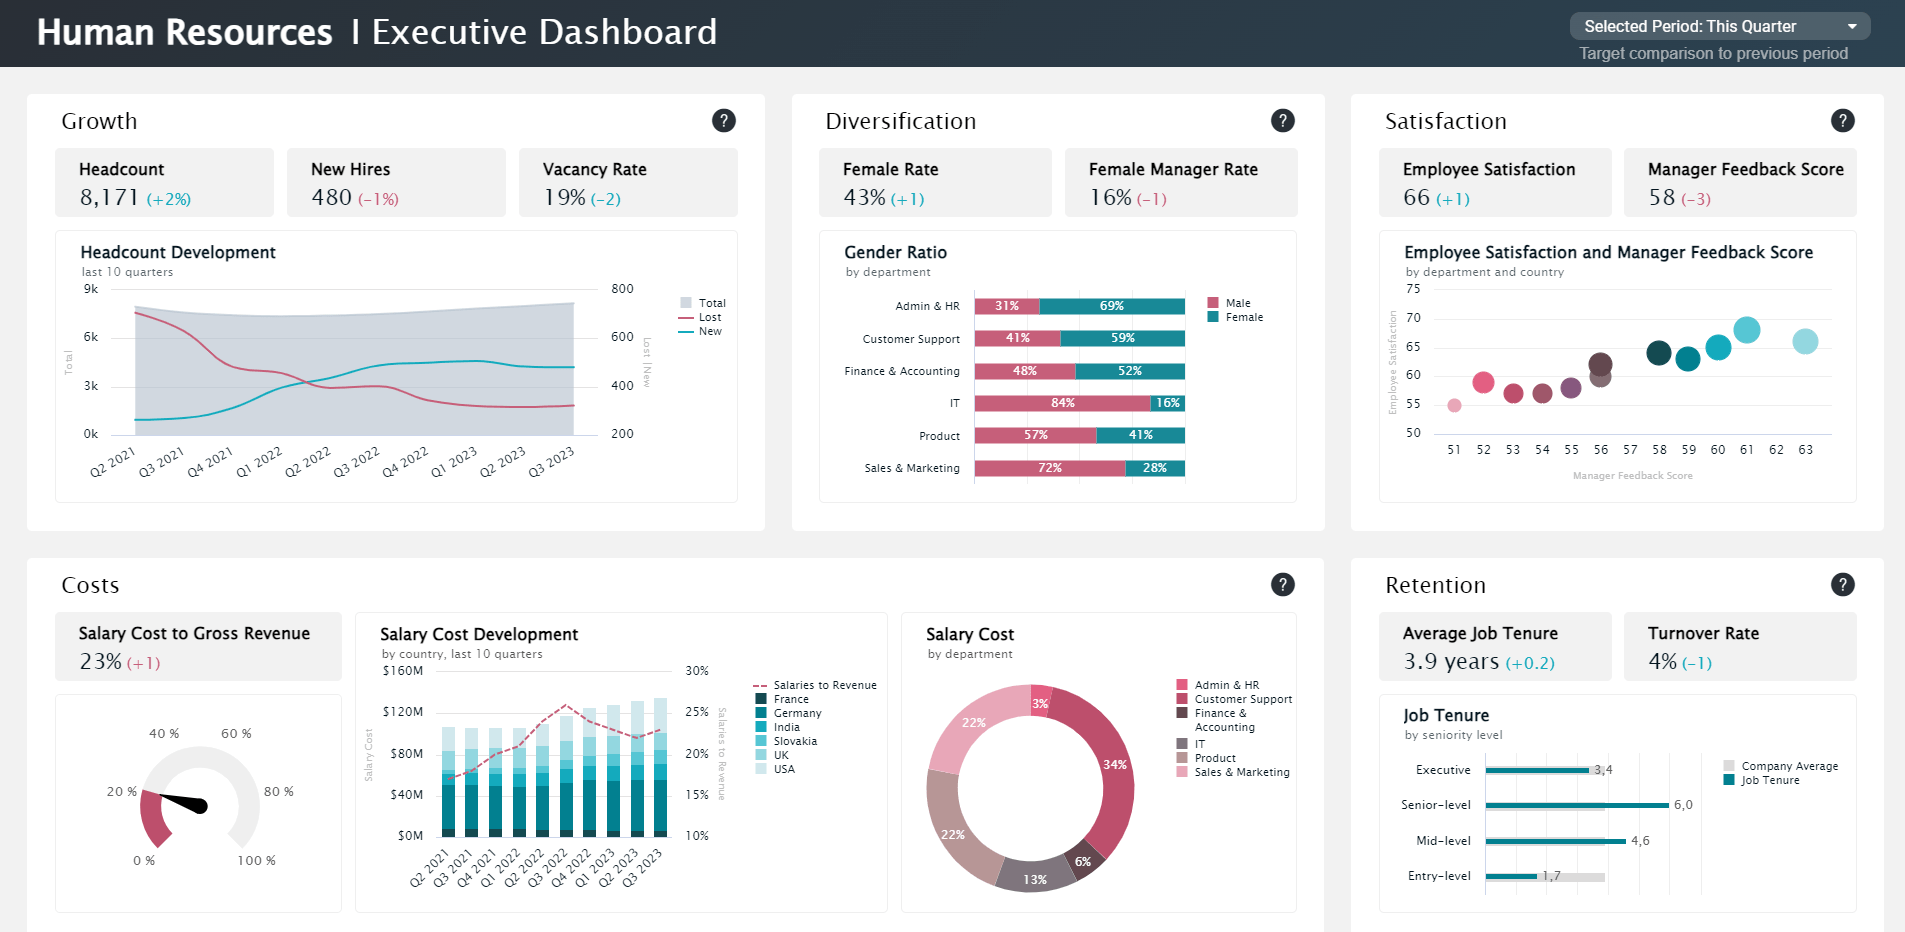
HR Executive Report
The increasing competitiveness across markets and industries has led businesses to increase the importance of their talent acquisition initiatives. Yes, hiring the best talent has always been a priority, as your employees are the ones in charge of innovating and boosting business growth. However, being able to hire and, most importantly, retain the right talent is now seen as a competitive advantage. Especially considering companies are still affected by the consequences of the Great Resignation of 2022, where $50 million US workers left their jobs, the highest number since they started tracking the stat in the year 2000.
**click to enlarge**
Taking all of this into consideration, organizations need to be prepared to offer their workforce the best working environment, with the right benefits and growth opportunities. To help in that task, our template above provides a 360-view of all aspects related to employee management in the areas of growth, diversification, satisfaction, costs, and retention. With these insights in hand, the CHRO, CPO, and other executives will be able to build strategies to boost retention while ensuring exponential organizational growth. Let’s explore the metrics portrayed in this template in detail below.
- Salary cost by department: This straightforward KPI tracks the percentage of salary-related costs by each department. The costs considered in the calculation of this metric include base salary, taxes, office space, equipment used, average sick days or vacation, and other health benefits, among others. Having this information in hand allows HR managers to plan budgeting and other strategies for the future.
- Salary cost development by department: This next indicator goes one step further from just looking at the percentage of costs by the department to comparing them to a ratio of the business’s revenue. Through this, decision-makers can understand what percentage of gross revenue salary-related costs account for and also assess if they are efficiently using their employees to generate returns for the company. Naturally, you want to keep this ratio as low as possible; therefore, looking into successful periods and replicating what worked is a good practice to ensure consistency.
- Salary cost development by country: On the same line as the previous indicator, this KPI tracks the salary cost development by country instead of departments. It is a great indicator for big corporations that employ people worldwide as it helps them keep track of costs and optimize where needed. It is important to differentiate between countries because the way expenses are calculated will vary depending on the number of people currently employed and different tax regulations, among other things.
- Employee satisfaction & manager feedback: Moving from the financial side, the employee satisfaction & manager feedback metric tracks how satisfied employees are with their managers. In this case, it is tracked by department and country to extract varied and valuable conclusions. This is a fundamental indicator to track as the manager-employee relationship can significantly influence satisfaction and productivity as well as boost retention rates. In fact, studies show that around 57% of workers leave their jobs because of their managers. Making this indicator fundamental.
- Headcount development: As its name suggests, this indicator tracks the number of employees who entered and left the company during an observed period. It includes full-time, part-time, and temporary workers in its calculation. It is a valuable KPI to track as it provides managers with insights to plan their costs as well as their retention and recruitment strategies. It is important to mention that this indicator is more valuable for big enterprises with a large workforce.
- Average job tenure: Last but not least, the average job tenure tracks the average time in years that an employee spends working at a business based on their seniority level. As seen in the dashboard above, entry-level workers have the shortest job tenure. This is unsurprising as young employees are usually less engaged or likely to stay at the same job for multiple years.
3. Monthly HR Report Template And KPIs
Monthly HR reports offer significant opportunities to connect businesses with new talents while obtaining an overview of the contributions being made by their current employees. A human resources monthly report impacts business outcomes in a variety of ways, from new recruitment and hiring strategies to measuring efficiency levels within a month.
Here, we’re going to look at a business report example in the form of an HR report sample that focuses on these particular mentioned areas.
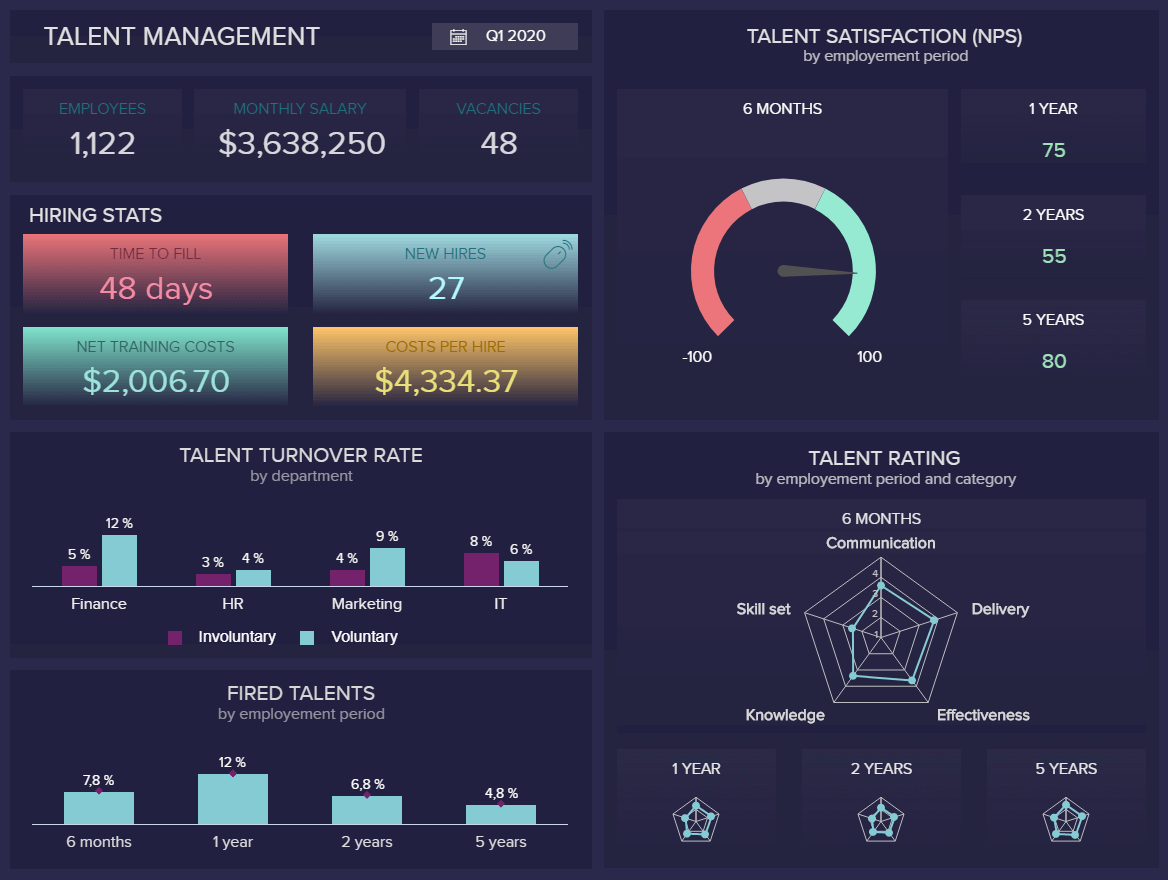
a) Monthly Talent Management Dashboard
In order to attract, motivate, and keep high-performing employees, a talent management dashboard can help HR professionals to gain a full overview of processes that are becoming key functions in HR. Today it's not only crucial to attract the right expertise but also to keep such employees by measuring their satisfaction levels and turnover rates and introducing rating systems across the board.
**click to enlarge**
In our example, we can see that the focus is on a quarterly basis, but it can also serve as a template for monthly and annual talent management strategies too, depending on your company's general rules and processes. You can also use it as a template to the board when you need to expound on costs and question talent management strategies.
At the top left of the dashboard, we can see a simple overview of the number of employees, monthly salary, and vacancies, continued with hiring stats. These stats can quickly show how many investments you need to make in order to train a new employee and how much time you need to fill out a position. You will always experience costs when hiring a new person, but the point is to keep those costs sustainable. Let's see the visualized metrics in more detail:
- Talent turnover rate: The rate by the specific department can tell you which area of business needs more attention when it comes to voluntary and involuntary leaves. In our case, we can see that the finance department has the highest voluntary turnover, so it would make sense to dig deeper into the reasons. Maybe your competitors offer better working conditions and salaries, or they don't feel like they have proper growth and progression opportunities, lack recognition for their work, etc.
- Fired talents: This metric will show you how many employees have been laid off, depicted by the employment period. In our example, we can see that most employees have been dismissed after the first year of employment. There is a number of reasons for this: organizational adjustments, downsizing a department, poor performance, etc. If you see that this percentage keeps growing month after month, you may have to change requirements during the hiring process because, in some instances, a higher rate can increase costs.
- Talent satisfaction: Today, it's crucial to keep employees happy, engaged, and productive. Many companies have issues with finding the right candidate, but keeping them is another challenging part of HR. The satisfaction rate, in the example above, shows a simple overview through the net promoter score (NPS). It's based on a simple question on how likely the team would recommend your company to someone (friend, family, etc.). If the NPS is improved and employees want to recommend you as a good workplace, you will reduce the turnover rates and keep the labor costs down.
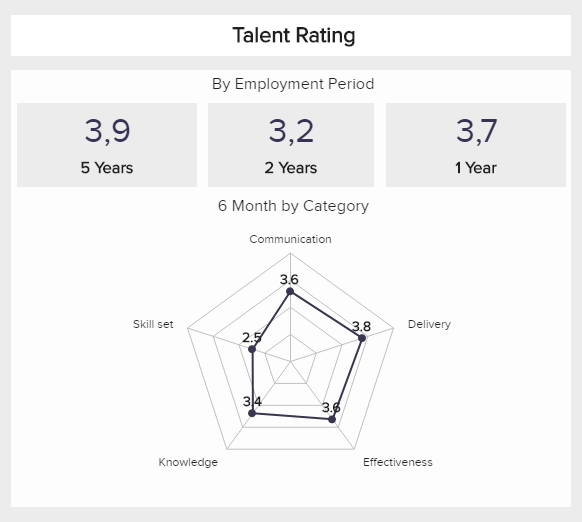
- Talent rating: This metric will help you in developing a comprehensive image and make sure you base your decision both on clear data and also on the human perspective of employee rating processes (real-world feedback talks). In this case, we can see that the rating is divided by the employment period and category for a longer period, but you can use this HR reporting and analytics template to develop weekly ratings, monthly, quarterly, and/or annually. Here is a detailed visual example:
b) Monthly Recruiting Dashboard
This priceless HR monthly report template below drills down deep into the acquisition of fresh new talent that will help drive the business forward. Your staff is the people who can make or break your business, which means that hiring the right talents for your company is essential.
**click to enlarge**
This example has the potential to match your organization with the right people for specific job vacancies. Additionally, by working with a mix of targeted KPIs, you’ll also be able to make your recruitment processes more efficient both in terms of cost, time, and turnover.
Here are the most prominent recruitment metrics that are affiliated with this specific HR monthly report template:
- Cost per hire: Indicates everything you need to find the perfect personnel for your business and measures the number of resources that are invested for each new employee. This includes all the expenses from the recruitment processes – such as advertisements, marketing, and referral incentives – and the training cost – such as the time of managers, instructors, and materials. The company budget needs to be considered during the hiring process. Therefore, investments in talent will bring back value. KPIs include costs per hire according to the recruitment score to see which is the most or least expensive.
- Recruiting conversion rate: This enables businesses to discover the best method for selection and focuses more on HR executives than regular employees. KPIs measure the ratio of the total number of applicants who convert to hired employees at the end of the recruiting process. Ratios are dependent on region, sector, and company. The main purpose of this metric is to find the source that provides the best candidates at the lowest cost.
- Turnover rate: This metric enables businesses to track their retention efforts and measures how many employees must leave the business. It tracks retention efforts and facilitates plans for talent replacement. Root causes for turnover rates can be monitored so that potential problems can be identified and fixed in the early stages.
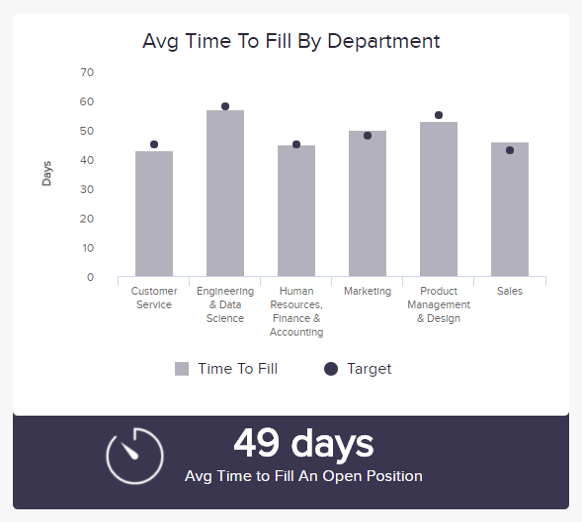
- Time to fill: Track how long your company needs to find a new employee by measuring the time elapsed between a job offer and when a new employee is hired. This informs the realistic planning process, such as layoffs and quitting employees. KPIs include reaching an objective and evaluating a process rather than lowering numbers at all costs shown in the example below:
c) Monthly HR Report Metrics Examples
In addition to the KPIs linked to our recruitment human resources monthly report template, there are other metrics you can use to enhance your HR monthly reports:
HR efficiency
- HR FTE (Full-Time Equivalent) ratio: the number of FTE per individual HR FTE monthly.
- HR costs per employee: this is the HR expense for each employee on a monthly basis, dependent on headcount.
- HR costs per FTE: the HR cost for each FTE on a monthly basis.
- HR headcount ratio: the number of staff per individual HR staff person.
- Total HR costs as a percentage of overall labor costs: the total cost of HR as a percentage of total labor costs on a monthly basis.
- Total HR costs per employee for permanent and non-permanent employees: the total cost of HR for each employee in a month.
Labor relations
- Union percentage: in terms of the human resources monthly report template, this includes the number of employees belonging to a union as a percentage of the overall headcount.
- Issue Resolution Cycle Time: This measures the average number of hours needed to settle different concerns – general issues, serious issues, potential lawsuits, and labor conflicts.
We offer a 14-day free trial. Start creating great HR reports today!
4. Weekly HR Report Templates
Weekly reports should focus on metrics that need to be checked more regularly in order to avoid potential monthly or quarterly HR surprises. Here we take a look at some examples that can be tracked on a weekly basis.
a) Monitoring Overtime Hours:
One example could be the number of overtime hours that helps HR professionals to spot if there is a temporary higher volume of workload, the staff is under more pressure, or if this metric increases over time and there is a need to examine things on a deeper level:
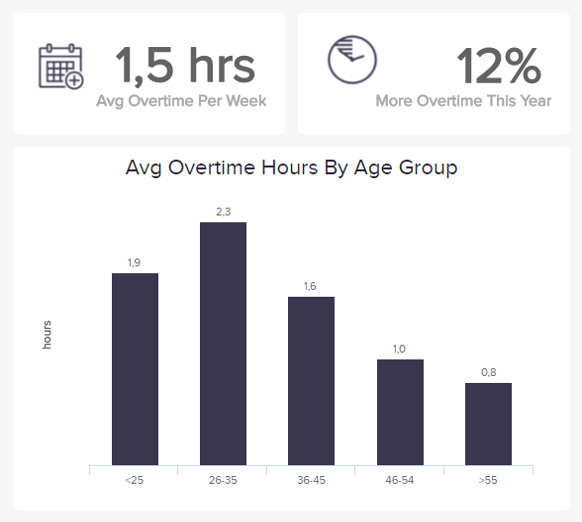
You can combine the overtime hours with the absenteeism rate to see if a higher number of employees call in sick. If the overtime hours continually increase, there is a strong chance that more people will lose motivation and start skipping work. Consequently, this could lead to serious business issues.
b) Tracking The Recruiting Conversion Rate
A modern dashboard maker will enable you to quickly create interactive metrics such as the recruiting conversion rate, which will enable you to automatically update your data and offer a time-efficient solution to monitor the weekly performance of the HR department. This metric can be used both by internal HR professionals or agencies that need to have a clear overview of their hiring results.
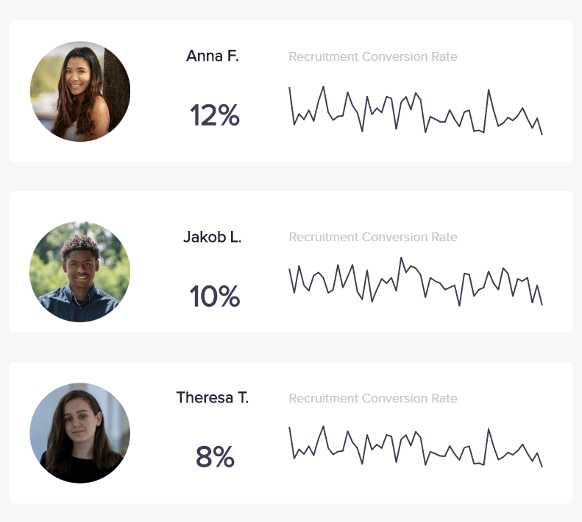
This metric has a focus on the HR department, where professionals can monitor how they performed on a weekly basis, especially freelance talent managers or agencies that need to achieve a healthy conversion rate in order to stay competitive. In our human resources reporting example above, we can see how 3 agents have performed and the development over time. There is no strict formula for an efficient recruitment process as it varies between companies, regions, industries, etc. The point is to have a high conversion rate but also to compare it to other important metrics, such as the retention rate, in order to perform effective hiring processes truly.
To learn more about different performance-based tracking options, we suggest you read our guide on performance dashboards.
We have presented these 4 main types of HR reports, and now we will take a closer look into why these reports are critical for modern business management and show you how you can extract value with modern HR reporting software.
Why Do You Need HR Reporting?
It’s clear that a human resources report is critical if you want your HR department to thrive in our data-rich age.
Comprehensive business dashboards provide companies with the ability to forecast future HR events for risk mitigation and effective planning via predictive analytics capabilities. There are some key reasons to utilize human resources reports during specified time periods, such as weekly, monthly, and annual. To put this into perspective, here are 6 primary reasons why you should embrace the power of human resource reports:
- Identify problem areas: These reports provide a great way to track issues in an analysis-driven, transparent method. Managers and other professionals are able to determine turnover rates per manager and pay close attention to employee retention efforts, and HR departments can leverage the information to define and implement improvements. Moreover, consolidating all HR data through a single point of access through a KPI dashboard will bring faster reactions to potential issues in order to develop better HR management information reports and solutions.
- Manage information: a monthly or annual template will provide in-depth insights into the ongoing developments within various teams and departments. This can include an indication of risks, such as an abnormally long replacement time period when an employee is about to leave the business. Effectively managing information in HR is critical in order to be successful, and a regular reporting practice can increase efficiency exponentially.
- HR monitoring: Businesses can follow critical metrics within their workforce and discover trends and opportunities during the early stages. Also, problems can be handled before they negatively affect the organization. Besides, automating the monitoring process can bring professionals more time to focus on other critical tasks and goals.
- Effective planning: An HR reporting structure is an exemplary way to plan strategies and initiatives in areas from hiring to employee engagement and beyond by painting a clear, data-driven picture that will ultimately allow you to make informed decisions that yield real long-term results. With modern analytical processes, data can be immediately accessed as business questions arise but also enable professionals to plan more effectively and strategically.
- Predictive forecasting: Building on the previous point, it also offers a viable means of predictive forecasting by analyzing digestible data that aligns with your business’s short-term and long-term goals. If you can make accurate, informed decisions backed by quality visual data, you will perform better – it’s that simple. The introduction of predictive analytics into various corporate areas, including HR, has made decision-making more efficient as well as faster.
- Enhanced communication: The flexible, user-friendly nature of HR monthly reports or annual HR reports means that everyone working both within and outside your HR department will be able to extract value from the data before them and, if required, access a live dashboard from a number of devices or media 24/7. This, in turn, will improve communication throughout the organization. Moreover, automating the monitoring process through modern solutions and presenting the information in an office setting through a TV dashboard can ease communication within the team and improve HR meetings.
Generally, a cohesive, well-oiled HR department will help to catalyze internal training and development, keeping your staff engaged and upskilled on a continual basis. By fostering solid company culture, regularly updating internal values and regulations, and keeping organizational structures flowing, your HR department can be responsible for helping everyone within the business remain motivated and focused. Our HR report examples have shown some ways how to do it.
Moreover, a solid HR department will play a pivotal role in recruitment, ensuring that you make the best and most valuable hiring decisions for your business. If an HR department is well organized, approachable, reliable, and able to iron out any potential issues or conflicts of interest, your staff will feel safe, confident, and more loyal. Besides, all these reports that we have expounded on will have better results.
It’s clear that your HR department is an integral part of your business – it’s the beating heart in many ways – and if you run it the right way, you’ll reap great rewards. One of the most effective ways to enhance your human resources department is by adopting a data-driven approach by using reports to your advantage. Human resources reports play a pivotal role in the effective management of your business’s human HR activities, big or small, weekly, monthly, or annual. The point is to choose the metrics you want to monitor in a set period of time and schedule your reports so they can be updated automatically without the need for more manual work. As we've seen in our HR monthly report examples above, the updating is done automatically based on our set time periods.
Additionally, HR reports, at their core, foster informed decision-making, enabling partners, investors, and stakeholders to gain a wealth of invaluable insight into the organization. With the current accelerated rate of digital technologies available to augment HR processes, it’s vital for businesses to take advantage of modern dashboarding methods. Not only will you be able to put all your information under a single umbrella, but the visual capabilities will enable you to spot any issues immediately without the need to manually look for information or scroll through countless spreadsheets and files.
BI dashboards provide consistent value for all types of business models and industries with accurate management reporting capabilities – and that, in a nutshell, is why they’re so incredibly valuable.
Best Practices For Quality HR Reporting
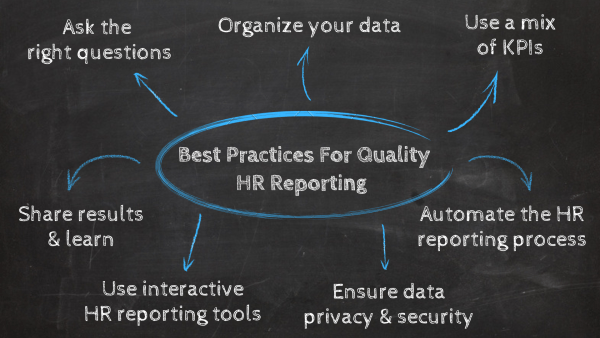
By now, you should have a deeper understanding of what HR reports are and how your business can benefit from them. We’ve been through a complete list of practical examples and showed you crucial metrics that should be included in your HR analytics. Now it’s time to look at some essential best practices that will help you generate a successful HR reporting strategy.
1. Ask the right questions
The first point of this list is a step that should never be ignored when dealing with your HR data. As with any other department in your business, HR collects large amounts of information that can help you understand how well your company is doing in terms of employee productivity, management, and satisfaction. For this reason, using the right HR data can make a difference in whether you assess problems and opportunities in your HR department accurately.
In order to avoid losing time working with all the data available, before you start to create your HR reports, you need to ask yourself the simple yet powerful question: what do I need from the data? This question can be answered by considering the answer to other questions like What is the main message I want to give? Who will use my HR reports? What is the report frequency? What context do I want to give to my reports?
By answering all of these questions in advance, you will be able to filter the data and keep only the information that is relevant to answering your main questions. This way, you will dive into your HR tracking process with an organized mind, making it more effective time-wise and significantly reducing the possibility of errors for considering the wrong data in your analysis.
2. Organize and clean your data
Once you’ve defined your general needs by asking relevant questions, it is time to gather the data and organize it in a way that will serve your analytical purposes. The first step in this regard is to define the external and internal data sources that you will use and prepare them for analysis.
For instance, you might collect data about employee productivity, absenteeism rates, overtime hours, and others. To collect this data correctly, it is important to classify your employees. Will you consider part-time workers in your analysis, or will you generate a separate report for them?
Another key point during the data collection process is to ensure everything is clean and correctly formatted. Businesses gather massive amounts of information on a daily basis, this information is not always ready for analysis. Therefore, it is important to use the right tools and technologies to ensure the process of data cleaning is automated and performed efficiently. Tools such as datapine provide the perfect environment for your entire data management process. All you need to do is connect your sources, and the information will be ready for analysis. Plus, it will update in real-time, so you always have the latest insights available to you.
3. Use a mix of HR KPIs
Once you have defined the general questions and aims of each of your HR reports, it's time to choose the metrics that will help you visualize your performance and achieve your goals.
As we mentioned before in this post, many metrics can be tracked weekly, monthly, or annually depending on the aim of your reports and the conclusions you want to draw from them. For this purpose, you should pick metrics wisely, your HR reports should be a mix of powerful KPIs that together will boost your data storytelling and enable better decision-making by giving a bigger picture of all areas of your HR department.
To help you in this task, take a look at our KPI vs metrics blog post!
4. Automate the HR reporting process
Whether it is hiring new employees, planning training opportunities, or ensuring that your business has an optimal work environment, HR managers have their hands full. This makes finding time to perform detailed HR analytics reporting hard, as the manual process of collecting the right data from different sources can be extremely time-consuming.
The answer to all these problems is report automation. By automating your reports, your HR team will be able to focus on decision-making and strategizing, leading to performance optimization of the whole department.
There are many tools in the market that include automation features that will allow you to work with autogenerated reports with the latest HR data available. datapine is a BI tool that offers the possibility to get all your sources in one place with just a few clicks. All you have to do is select your most relevant KPIs, and the tool auto-generates reports that will be sent to selected recipients in a defined schedule. This way, your HR managers and other relevant stakeholders will receive daily, weekly, or monthly HR reports with the latest data available.
5. Ensure data privacy and security
Moving on with our list of human resources reporting requirements, we have the topics of privacy and security.
Employee and customer data are probably the most sensitive information that businesses gather from their operations. This includes names, IDs, addresses, phone numbers, bank accounts, social security numbers, and a lot more. If this information falls into the wrong hands, it can directly affect the workforce as their data can be used for cyberattacks.
To prevent this from happening, it is fundamental to implement security and privacy measures across the entire HR reporting process. From data collection to report generation to share it with others via secure channels.
Some best practices you can follow to ensure security and privacy are to invest in a tool that offers a secure environment for your sensitive data, implement a governance framework to define clear roles and responsibilities regarding who can access and manipulate your data, and closely investigate any suspicious activity to prevent any issues from happening.
6. Use interactive HR reporting tools
Although automating your HR analytics process is an undeniable benefit, making sure that your reports are visually appealing and interactive is what will ultimately drive your HR success.
For many decades, HR reports have been created manually in static PowerPoint presentations or lengthy text documents that were tedious to read and analyze. Today, thanks to the growth in companies leveraging their data, many tools have emerged in the market to make the reporting process more efficient and effective.
datapine is an all-in-one business intelligence reporting software that helps you analyze, transform, and monitor data from multiple sources and present it in a visual manner to provide actionable insights from your HR reports. Additionally, the tool offers a dashboard designer that allows you to create interactive reports with just a few clicks; this way, you can have all the latest data presented with powerful visualizations that will boost your HR department's performance.
7. Uncover trends, share your results & define the next steps
Once you’ve defined your business goals, the metrics you want to use, and the frequency of your reports comes the moment to extract actionable insights from your data.
While analyzing your HR reports with the help of an online analysis tool, make sure you always look for trends in the data. This way, you will be able to predict future outcomes and plan your strategies accordingly. For example, by using historical data, you can predict the likeliness of an employee to quit within a given timeframe and step in with preventive measures that will increase employee engagement.
By extracting this and other advanced conclusions from your reports, you’ll be able to create strategies based on facts, not just simple intuition. After thoroughly analyzing your reports plan your next steps and share them with relevant stakeholders so that everyone in your organization can be aware of future developments.
HR Reporting Common Challenges & Mistakes
Just like any other business-related task, generating human resources reports has its challenges. As you learned through our list of best practices, to be successful in the process, you need to be aware of several elements that need to work together to achieve your analytical goals. Below we will list some of the most common challenges or mistakes companies make when performing HR analytics to help you prevent them from happening.
Not being compliant: Just like it happens with customers, employees are protected by laws and regulations that businesses need to follow. These include employee classification, paying overtime hours, and protecting sensitive data, among others. It is fundamental to ensure all of these regulations are being respected and considered during the reporting process because it will play a significant role in the way strategies are built. Plus, if some of these regulations are not respected, it can bring several consequences for the organization.
Data quality: We already mentioned the topic of cleaning your data earlier in the post, but we will mention it again as it is one of the biggest challenges for organizations. Your analytical efforts will be worth nothing if your data is not correct. Using bad-quality HR data can cost the company significant financial loss by implementing strategies based on inaccurate insights. To prevent this from happening, it is essential to implement a data quality management strategy to govern your analytical efforts in the most efficient and effective way.
Focusing on too many things: We know that it is tempting to grab all of your available insights and put them together into a report. However, in practice, this will only make the process confusing and unproductive. To avoid this mistake from happening to you, it is important to identify clear areas in which your company’s HR efforts are lacking and define goals and strategies focusing on those areas only. This way, you’ll only track the data that relates to those goals and avoid getting lost in a sea of numbers and graphics. Always remember this mantra: just because something can be measured, it doesn’t mean it should be.
Focusing only on historical performance: Traditionally, the HR reporting process was static and composed solely of historical data. This method is no longer valuable today as the amount of information businesses are generating on a daily basis is exponentially growing, making old data quickly outdated. That is not to say it is not valuable, historical data hides valuable trends and patterns that can help predict future outcomes and build better strategies. That is when paired together with real-time insights that can provide a better understanding of what is actually going on in the present. Tools such as datapine, provide real-time HR analytics that can be combined with historical analysis to generate accurate forecasts and help in generating budgets and making important decisions.
We offer a 14-day free trial. Start creating great HR reports today!
Support Business Strategy Development With Interactive HR Reports
Now that we’ve uncovered the meaning and undeniable value of human resources reports, we will finish this complete guide by delving into using this wealth of data to align your business goals and objectives.
As we mentioned before, HR departments need to align with business objectives that are defined by senior-level executives and other key leadership teams. Furthermore, performance management, employee engagement, and turnover are typically better managed with the insights provided by interactive data dashboards.
The role of HR reports for management is to help companies obtain a clearcut overview of important HR data from across diverse systems, as well as the analysis of key performance indicators in real-time, to make predictive decisions and gather information methodically.
Though metrics and HR report templates can be customized, some key features include important standard metrics that provide companies with an organizational overview of HR department activities:
- Age
- Sex
- Education level
- Training costs
- Recruitment costs
- Function type
- Active employees
- Turnover
- Absences
- New hires
- Cost of labor
- Recruitment costs
These HR-centric metrics and KPIs serve to provide businesses with customized information that can be applied towards meeting their marketing, design, supply and demand, and overall strategic objectives and goals.
Consistent analytical reporting over specified time periods, such as monthly and HR annual reports, will keep businesses updated on all elements of human resources activity in timely, scheduled increments.
Whatever the dashboard – whether it’s a report for management, an annual report template, or a monthly online data visualization of employee performance – it’s clear that taking a data-driven approach to your HR department is essential in today’s digital world.
HR departments no longer play a supportive role in an organization’s business development strategies. On the contrary – human resources serve to enhance and augment a business’s overall success and set the pace for an organization’s future.
Data analytics and reporting tools are the protocol needed for businesses to create better processes and training procedures, be proactive about management, monitor trends in their HR department, and utilize personnel most effectively. HR monthly reports and HR annual reports are the keys to optimizing human resources goals.
Companies can visualize their most invaluable HR data with dashboard software that provides them with enhanced graphs, charts, tables, metrics, and KPIs to better understand the wealth of insights before them.
Now that you’ve journeyed deep into an HR report template or two and understand the value of these dashboards for business growth, you’re ready to accurately evaluate crucial HR components over set time periods with dynamic, automated HR dashboards. Try datapine for free with our 14-day trial!