Track Debt-to-Equity Ratio for Better Understanding of Risk
The debt-to-equity ratio is one of the simplest metrics to calculate (total liabilities/total shareholder value) and also one of the most important. Why? Primarily because it gives companies a clear indication of their risk exposure as they move forward in an uncertain economy.
When the debt to equity ratio is greater than one, it means a company is carrying a large amount of debt proportional to the equity on hand. Becoming overleveraged with debt raises the risk of insolvency because of the heavy repayment burden. A large ratio can also make a company less attractive to lenders and investors.
A ratio of less than one means the company has more equity than debt. Raising capital may be easier as these companies are seen as less risky, but they could also pay more taxes because they’re not taking advantage of deductions for interest payments.
The ideal debt-to-equity ratio varies. For some companies, it’s greater than one and for others, it’s far below that. However, in all cases, companies need to track it closely. Strategic CFOs, financial decision makers, institutional lenders, and potential investors all look at the debt-to-equity ratio to make evaluations about performance and strategy.
When so much depends on having a clear and accurate understanding of debt-to-equity at all times, companies need to ask themselves a simple question: Is it really clear and accurate?

Finding the Ratios Inside the Data
The formula behind the debt-to-equity ratio may be simple, but that doesn’t mean consistently tracking this metric is easy. Trying to accurately add up total liabilities and total assets typically means searching through the ERP for data and then manually transferring it over to Excel where it must be further manipulated. Because the process is so “hands-on,” it requires a lot of time and creates a high risk for human error leading to bad data that distorts the final ratio.
Making matters even more difficult, CFOs need to be tracking the debt-to-ratio at all times. Quarterly updates are no longer adequate for decision makers who want (and need) to base all their actions on the best financial insights available, including an updated snapshot of the debt-to-equity ratio. However, constantly updating the ratio requires more time and ongoing input than most companies can dedicate, especially when that’s part of a broader effort to track myriad financial ratios for the purposes of data-driven decision-making.
As more companies conclude that their need for data exceeds their ability to manage it manually, they’re looking for alternative ways to track the debt-to-equity ratio, along with other critical metrics. Fortunately, those alternatives have never been better.
A New Approach to Financial Ratios
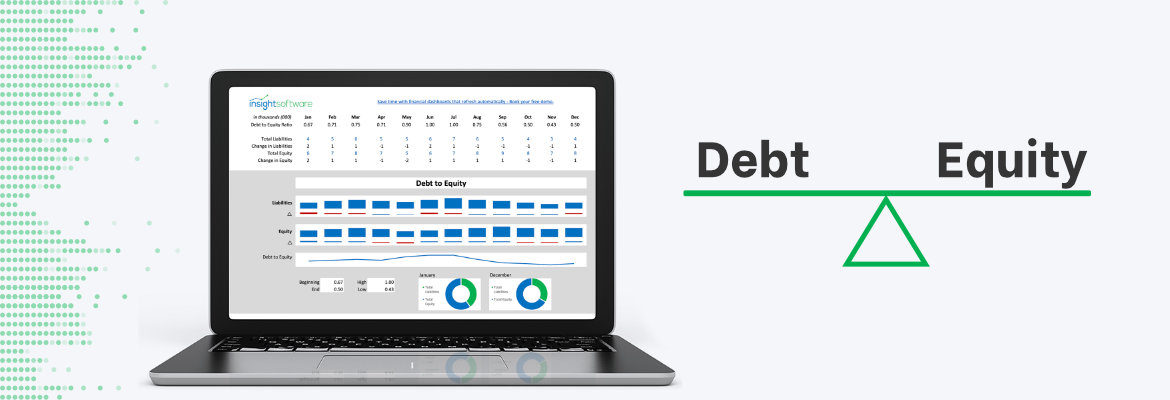
The innovators at insightsoftware have pioneered a new way to track the debt-to-equity ratio that relieves the two biggest hurdles. First, it automates data collection and analysis. At the start, users define what data they need. Our technology then collects and analyzes that data on a schedule or on-demand, instantly providing the latest ratio. Second, it presents that information in a dashboard format that’s optimized for accessibility and digestibility. Decision makers don’t just have the current metric; they also have important information for context and historical analysis, including drill-down capabilities.
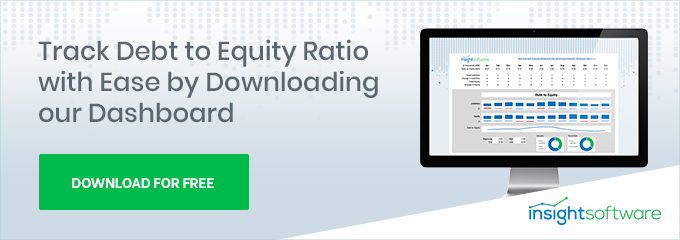
The best way to appreciate what one of these dashboards could do to relieve administrative hassles and improve strategic thinking is to experience one yourself. Access a free debt-to-equity dashboard download from insightsoftware that shows you exactly how today’s data is meant to look and feel.