Car Sales Demand Forecasting Using Pycaret
This article was published as a part of the Data Science Blogathon.
Introduction
In this article, we will try to predict the car sales demand given the train and test data. This problem was introduced as a JOBATHON competition on the Analytics Vidhya platform which ran from 22 April 2022 to 24 April 2022. The data that we used was available to only those who were registered in the competition and gave the MCQ test. MCQ test consists of 30 questions and each question had a timer of 1:30 minutes.
What is Demand Forecasting?
Demand forecasting is a field of predictive analytics which tries to use predictive analysis of historical data to understand and predict customer demand to optimize supply decisions.
In simple words, any product base company or business wants to know how much is the demand going to be for their product so that they can maintain the supply. To find or predict this demand historical data can be used. In the historical data, different variables can be provided related to the product. Using that information we can build a predictive model which will in turn predict the demand for a time window for the product.
What is Pycaret?
PyCaret is an open-source, low-code machine learning library in Python that automates machine learning workflows. It is an end-to-end machine learning and model management tool that exponentially speeds up the experiment cycle and makes you more productive.
Source: https://pycaret.gitbook.io/docs/
Basically, pycaret is a python library that can help a data analyst do his/her task in less time and make them more productive.
pycaret is a wrapper library that uses available machine learning libraries and automates the whole machine learning pipeline and reduces the time for model building.
In this article, we will see the power of pycaret and analyze the results for Car Sales demand prediction.
Problem Statement
ABC is a car rental company based out of Bangalore. It rents cars for both in and outstations at affordable prices. The users can rent different types of cars like Sedans, Hatchbacks, SUVs and MUVs, Minivans, and so on.
In recent times, the demand for cars is on the rise. As a result, the company would like to tackle the problem of supply and demand. The ultimate goal of the company is to strike the balance between supply and demand in order to meet user expectations. The company has collected the details of each rental. Based on the past data, the company would like to forecast the demand for car rentals on an hourly basis.
The main objective of the problem is to develop the machine learning approach to forecast the demand for car rentals on an hourly basis.
Exploratory Data Analysis
Feature Information
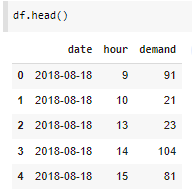
We are provided with three features date, hour, and demand in the dataset. There are no other variables.
Gather information from the “date” feature
Since there is no other information given that we can use for demand forecasting apart from “date”, we will collect possible information from the ‘date’ feature.
We Will capture ‘year’, ‘month’,’ ‘day’, ‘quarter’, ‘day_of_week'(dow) information from the ‘date’ feature.
df['date']=pd.to_datetime(df['date'])
df['year']=df['date'].dt.year
df['month']=df['date'].dt.month
df['day']=df['date'].dt.day
df['quarter']=df['date'].dt.quarter
df['dow']=df['date'].dt.dayofweek
Unique years in data
There are years 2018, 2019, 2020, and 2021 present in the data. Since this is a Time Series Data we will not split it randomly for model building but We will keep 2021 data for testing and will use other years of data for training.
df_train=df[df['year']!=2021]
df_test=df[df['year']==2021]
Feature Correlation
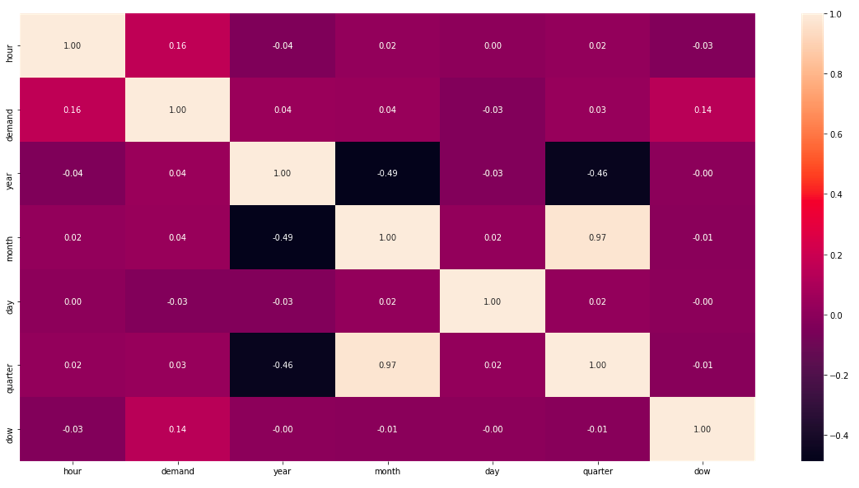
We can observe this in the figure above. There is no feature that has a good correlation with ‘demand’.
Model Building
Now we will use “pycaret” for model building.
Remove Unnecessary Features
‘date’ and ‘year’ information is not required while building the model. Since it is a time-series data years and dates present in training data will not be available in test data hence it is of no use keeping them.
df_train.drop('year',axis=1,inplace=True)
df_test.drop('year',axis=1,inplace=True)
df_train.drop('date',axis=1,inplace=True)
df_test.drop('date',axis=1,inplace=True)
Setup Model
Since ‘demand’ is a continuous variable we can say it is a regression problem. ‘pycaret’ requires setting the model, which is a step where we define the data and target variable.
from pycaret import regression
model_setup=regression.setup(data=df_train,target='demand')
Once we set up that model, it will show you the data types it has inferred from the data. If you agree you can press ‘Enter’ and continue with the set up else using ‘categorical_features’ parameter we can mention the columns that we think are categorical.
For now, we will go ahead with the data types inferred by the pycaret.
Compare Models
Now, we will use the compare_models functionality of pycaret. This provides us with all available regression/ classification(in our case it is going to be regression models) models along with their performances.
We can also exclude any model if we want to from the available model’s list using the ‘exclude’ parameter and we can also mention any specific performance metric which we want to observe using the ‘sort’ parameter.
In our case, we are using RMSE as a performance metric and just, for example, we will exclude one of the models as well.
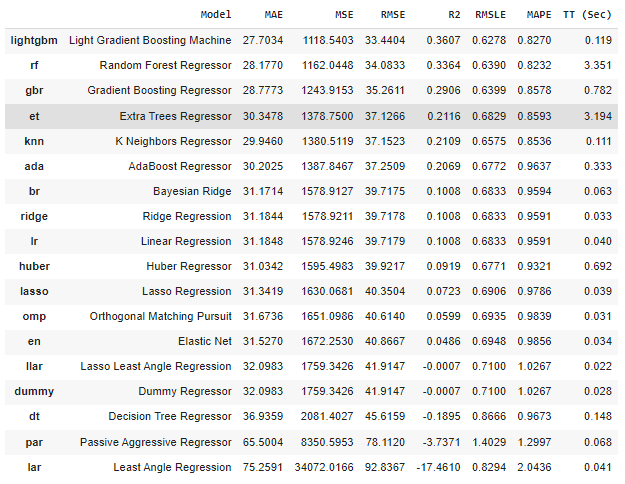
best=regression.compare_models(exclude = ['ransac'],sort='RMSE')
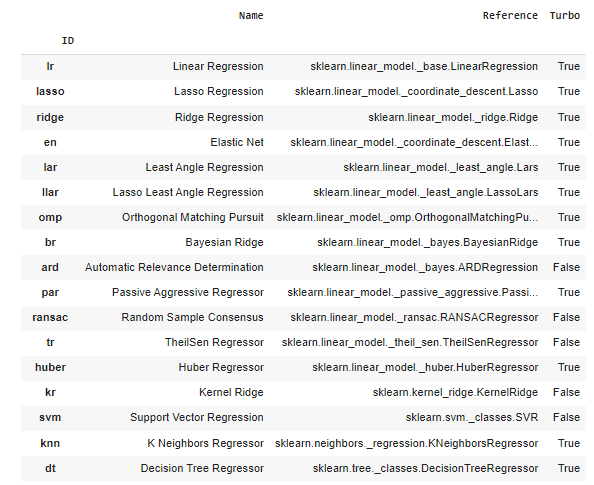
To see the list of available models we can use the ‘models()’ functionality of regression or classification from pycaret.
regression.models()
As we can observe while using compare_models functionality ‘lightgbm’ is coming up as the best model as per ‘RMSE’.
Now we will create the model.
Create Model
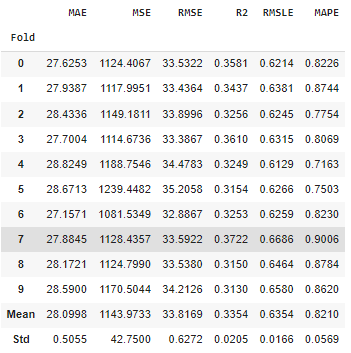
lightgbm=regression.create_model('lightgbm')
What create_model does is that internally it uses 70% of the training data to train the model and keeps the 30% data for evaluation of the trained model.
Tune Model
Now we will tune the model. If we provide a customer parameter grid then pycaret will use the custom grid else it will use the default parameter grid for tuning the model.
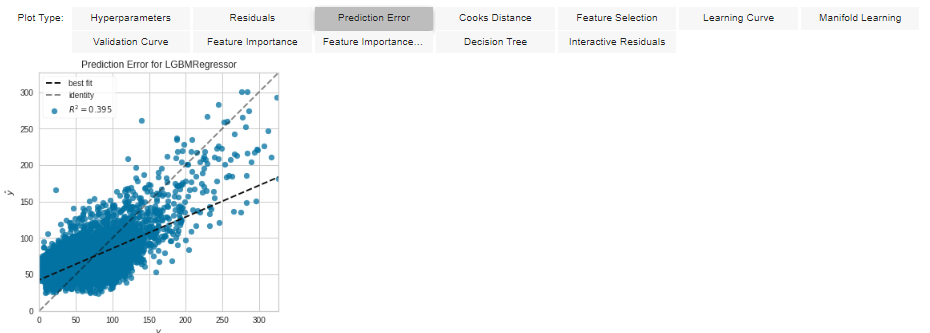
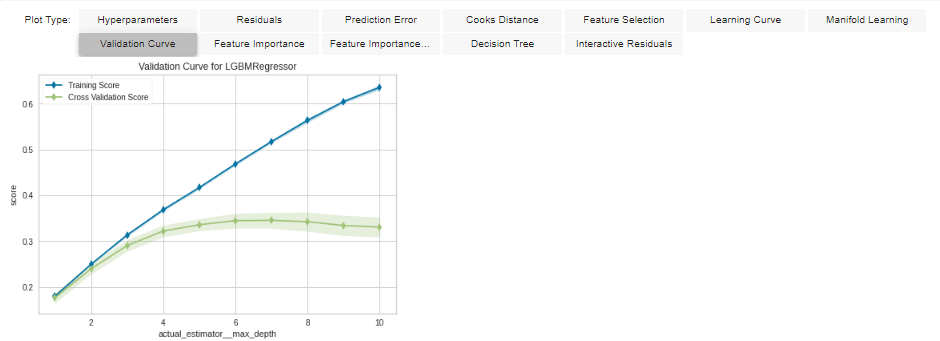
Evaluate Model
“pycaret” provides an interactive way to do the evaluation. It provides us with different plot types where we can analyze how the model is performing. Let’s see a few options:
Finalizing the Model
Once we saw the evaluation results model we will finalize the model. In finalize_model() pycaret uses 100% of the train data to build the model instead of 70% which happen in create_model() function.
final_lightgbm = regression.finalize_model(tuned_lgbm)
Evaluate Model on Unseen Data
Once we saw the results and finalized the model we can see how the model is performing on unseen data or test data.
unseen_predictions = regression.predict_model(final_lightgbm, data=df_test)
unseen_predictions.head()
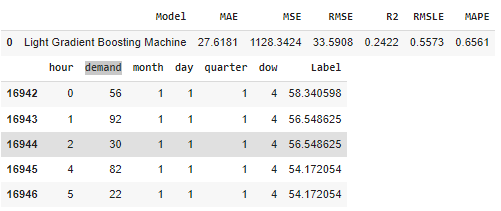
We are observing that RMSE is 33.5 which is really good.
Results
We learned that pycaret can help us build and choose the best performing machine learning algorithm. At any task at hand a data scientist usually do manually and wastes the time just to choose the best algorithm, pycaret helps us in building the whole pipeline in an efficient way.
We saw that “lightgbm” model’s performance was far better in comparison to all other available regression models. We got 33.5 RMSE for our model. In the competition, the best RMSE was 32.5. So in comparison to that, we got pretty good results.
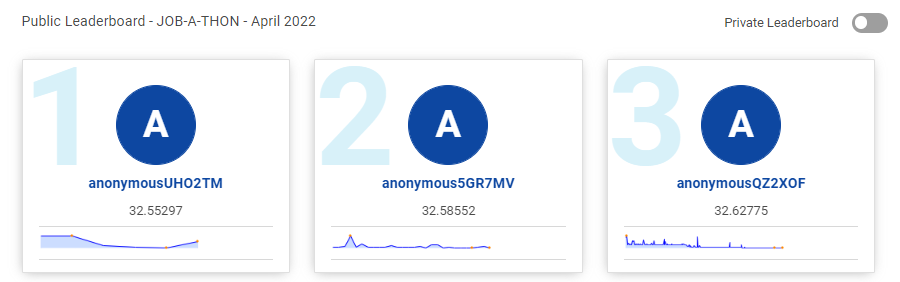
Source: Analytics Vidhya
Conclusion
Pycaret helps us choose and build the best model in a very efficient way. In pycaret, we can use the default performance metrics, and default Model Parameters or we have a choice of providing those values.
This functionality of pycaret is very powerful and it helps a data scientist save his/her time. In this article, the following were the key learnings for all of us.
- We got to know about Demand Forecasting.
- We Understood, what is Pycaret.
- We have observed how we can use Pycaret to build machine learning models easily.
- We learned, what are different functionalities of pycaret that help us build the predictive models.
- We saw an example of building a regression model using pycaret while solving the Car Demand Forecasting problem.
The media shown in this article is not owned by Analytics Vidhya and is used at the Author’s discretion.


