Introduction
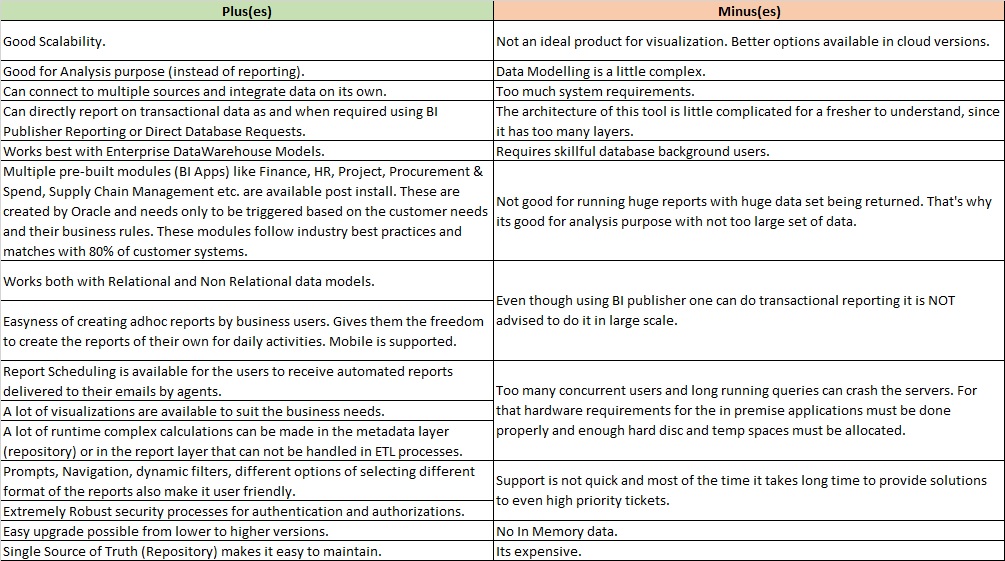
OBIEE: Oracle Business Intelligence Enterprise Edition Plus, also termed as theOBI EE Plus, is Oracle Corporation’s set of business intelligence tools consisting of former Siebel Systems business intelligence and Hyperion Solutions business intelligence offerings.
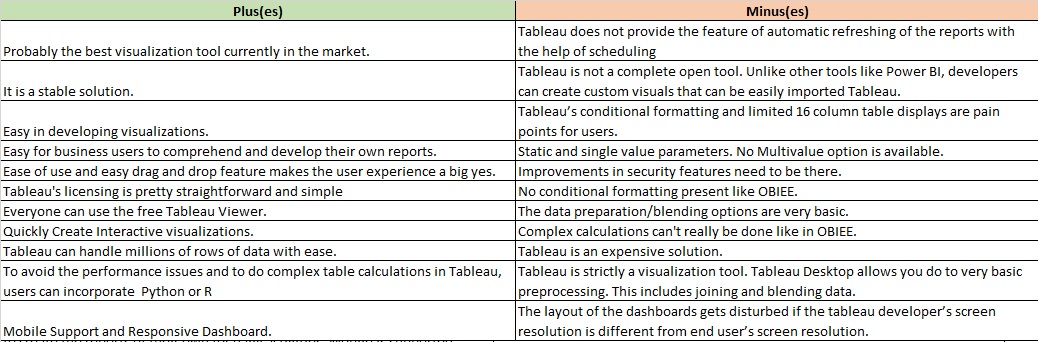
Tableau: Tableau Software is a software that produces interactive data visualization products focused on business intelligence.
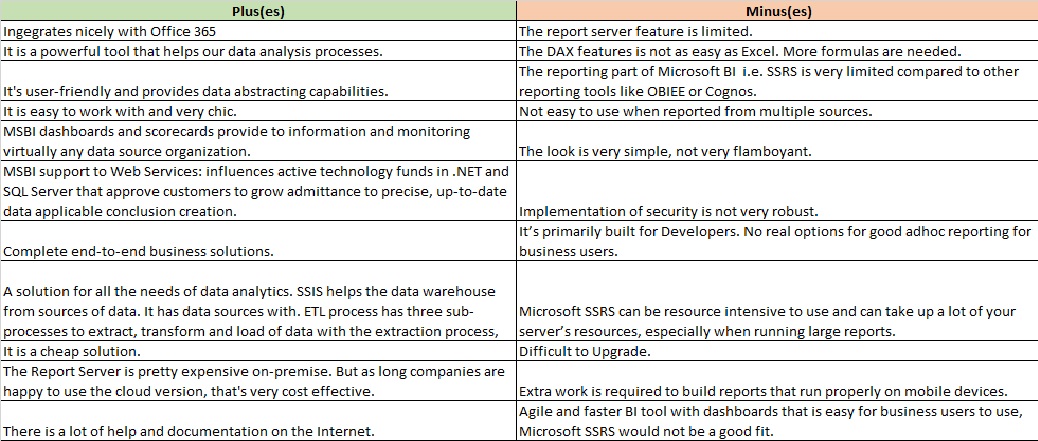
MSBI (SSRS): This powerful suite is composed of tools which helps in providing best solutions for Business Intelligence and Data Mining Queries. This tool uses Visual studio along with SQL server.
When to choose what
OBIEE is primarily used when analytical use is required by an organization. Slice and dice of data in complex dashboards, through prompts, filters navigation, comparison etc. are primary features of OBIEE. OBIEE is also one of best tools to enable adhoc reporting among the business users. OBIEE was designed for the web and had from the beginning an excellent scalability. So if the customers want to run reports and dashboards for a very large number of users they will be better of with OBIEE. Data visualization options are available in latest versions of OBIEE as well as it’s cloud counterpart.
Tableau: Select Tableau when data visualization is the primary and probably the only aspect for a customer hands down. Data Visualization Tools are the software tools through which the raw and unstructured data can be used as informative data to increase the Business insights and sales. Tableau offers you to make rapid business strategy and decision according to your huge data but with a simple data modelling approach. Anything complex in design will NOT work with Tableau.

The Future of Big Data
With some guidance, you can craft a data platform that is right for your organization’s needs and gets the most return from your data capital.
MSBI: It should be used when there is a need to report large volume of data. But with the introduction of Power BI, a data visualization tool and it’s integration with the cloud as well as shared point, (SQL Server 2016) it has spread its hand into visualization as well.
Comparative Study
1. OBIEE Pros and Cons:
2. Tableau Pros and Cons:
3. MSBI Pros and Cons: