The Concept Of Hypothesis Testing in Probability and Statistics!
This article was published as a part of the Data Science Blogathon
Introduction:
Hello Learners, Welcome!
In this article, we are going to learn about Hypothesis Testing. Hypothesis testing is a very important and elegant concept in Probability and Statistics. we know that to study a phenomenon or a fact, and gathering information about it is called research. and when we know about an event or fact, how it works, and even if we explain it what it is, but if we do not have any scientific proof of it, which means that we have not yet done scientific work on that fact or phenomenon. that is, we know only its explanation. that’s why it will now be called a Hypothesis.
The hypothesis is nothing but an assumption which we make by our observations. so probability and statistics are all about data, the huge amount of data, and that data is only useful for us if we can analyze the data and finally draw some conclusion about the data. and to find out interpretation and conclusion about the data we basically use Hypothesis testing. so now the hypothesis testing is to Evaluating two mutually exclusive statements on population data using sample data is called Hypothesis Testing. we will talk later on two mutually exclusive statements but for now, basically, try to understand hypothesis testing.
So validating one of the two alternatives assumptions by measuring the probability of population data using sample data with respect to our one of the two assumptions is true called hypothesis testing.
Null Hypothesis and Alternative Hypothesis:
So as we discuss earlier that Evaluating two mutually exclusive statements on population data using sample data is called Hypothesis. so the two mutually exclusive statements are known as Null Hypothesis and Alternative Hypothesis which are denoted by H0 and H1 respectively. in Hypothesis testing, if we want to reach a conclusion, then we have to make two statements in such a way that if one statement is true the other will automatically be wrong. in no case should both the statements be true or false at the same time.
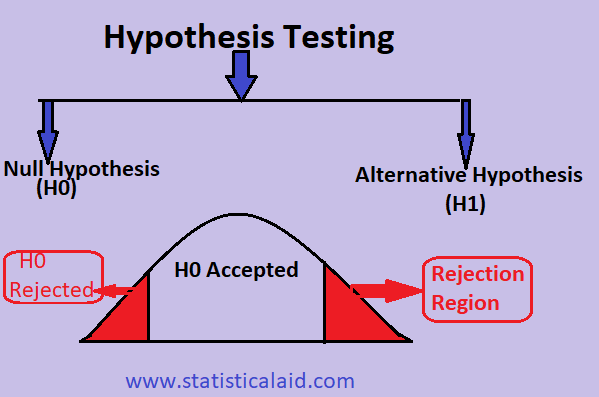
Null Hypothesis:
The null hypothesis is basically the deny or we can the negation of our whole hypothesis. the null hypothesis is trying to say that there is no statistical relationship or no significance exist in our observed variable. which means there is no such case that exists where our whole claim is true. The Null Hypothesis is denoted by H0 . null hypothesis should be in such a way that if we design an experiment for hypothesis testing, it is easy to experiment with the null hypothesis and easily get the result.
Alternative Hypothesis:
The alternative Hypothesis is exactly the opposite of our null hypothesis. the alternative hypothesis is our actual claim which we trying to find out with the help of statical relationships. there can be multiple alternative hypotheses that can exist. the alternative hypothesis is denoted by H1 or Ha .
Let’s try to understand the concept of the null hypothesis and alternative hypothesis by an example:
Let’s assume there are 2 classes that exist in the school. and each of the classes has 50-50 students in each. if you measure the heights of students in each class and found that the mean of heights of class 1 students is μ1 and the mean of heights of class 2 students is μ2. and then you claim that there is a difference between class 1 and class 2 students, so to prove your claim you have to do hypothesis testing. so for hypothesis testing our two mutually exclusive statements is as follows:
H0 ( null hypothesis ) = there is no difference exists in the heights of students of both classes.
H1 ( alternative hypothesis ) = There is a difference exists between the heights of both classes of students.
Steps of Hypothesis Testing:
So till now, we understand the type of Hypothesis and their notation. and also learned that how to describe the null hypothesis and alternative hypothesis. now the time is to learn about the steps of Hypothesis testing, so basically, the hypothesis testing is done in 4 steps, the 4 steps of hypothesis testing is as follow:
1. Defining two mutually exclusive statements.
2. Designing the test and test statistics for hypothesis testing.
3. Performing our designed test and finding the probability value for our test statistics.
4. Reject or select the Null Hypothesis based on the result of the third step.
Step 1st:
So in the first step we convert our claim or our assumption into two mutually exclusive statements. this is the step where we should define our Null hypothesis and Alternate hypothesis so that we further evaluate these hypotheses.
To better understand the steps of hypothesis testing we will consider an example so the example is, let assume we have a coin that contains head and tail on their two sides. so now we claim that the coin is biased towards the head which means that if we toss the coin randomly the chances of getting heads is more than the tail. which means the probability of getting head is more than 0.5. so if we perform the hypothesis testing to prove our claim, our two mutually exclusive statements are as follows:
H0 = The coin is not biased towards the Head.
H1 = The coin is biased towards the Head.
Step 2nd: So in the second step we will define that what is our test should be and what are the variables we are going to use in this test. the test must be easy and accurate to perform because this is the main pillar of our hypothesis testing.
So till now, we have our coin and our two hypotheses. so our experiment is that we flip the coin 5 times and we count the number of Heads and let’s assume that our random variable is X, which contains the result of each iteration or toss.
Step 3rd:
So in this step, we performed our designed test, in this step we calculate the probability of our test with respect to our null hypothesis. the probability P of our experiment is called significance value, the significance value is should be greater or equal than 5% in most cases but, in a special situation like the medical domain, the domain experts can decide the value of significance for minimizing the risk.
So in our example, let’s assume that we performed the experiment which means we toss the coin 5 times, and the outcome of our experiment X = [ h, h, h, h, h ] which means we toss the coin 5 times and get 5 heads.
So now we need to calculate the probability P, here the P is defined as,
P( X = 5 | H0)
Here the meaning of the above equation is that what is the probability P of our random variable X is to getting 5 heads in 5 tosses if our null hypothesis is true. so our null hypothesis is the coin is not biassed toward the head. so according to our null hypothesis,
the probability of getting head in 1 toss is P( H0 ) = 1/2 = 0.5 .
so if our coin is not biassed towards the head then the probability of getting 5 heads in 5 tosses,
P( X = 5 | H0 ) = 1/ 32 = 0.03
because if our coin is not biassed towards the head then there is only 1 possibility out of 32 possibilities to getting all heads.
The 32 possibilities are simply calculated by combinatorics:
1 iteration = h, h, h, h, h
2 iteration = h, h, h, h, t
3 iteration = h, h, h, t, h
……………………………….
……………………………….
32 iteration = t, t, t, t, t
So there is a 3% chance of getting 5 heads in 5 tosses if the coin is not biased towards the head ( null hypothesis H0 )
Step 4th:
So this is the final step in this step we will decide, that either we select our Null Hypothesis and reject our Alternative hypothesis or we reject our Null hypothesis and select an Alternative hypothesis. we should select or reject the hypothesis according to our significance value which we calculated in the above step.
Now the time is to draw our conclusion that is the coin biased towards the head or not. so we show in the above experiment that the probability of getting 5 heads in 5 tosses if our null hypothesis is true is 3% which is less than 5% significance value. so in this case we reject our null hypothesis and select our alternative hypothesis. which means we proved that the coin is biassed towards the head.
Resampling and Permutation Test:
In the hypothesis testing after designing the hypothesis, our next spet is to performing the test and calculating the probability P which is also called P-value. in the above example we calculated the P-value by simple combinatorics but there is another method to calculating the p-value called Resampling and Permutation Test. in this method we simply make lots of permutations of sample data.
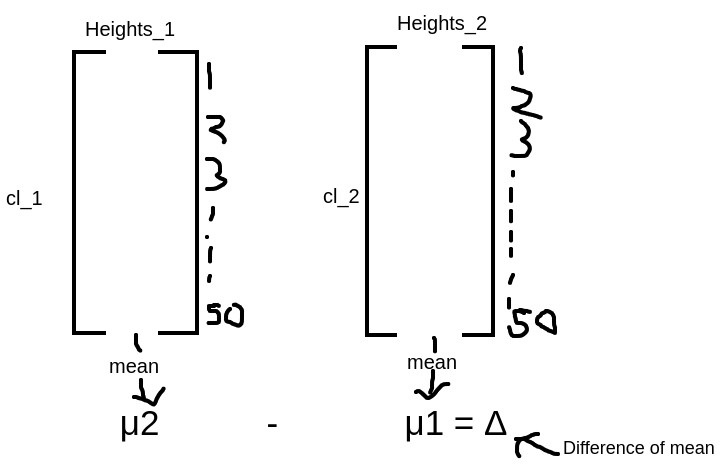
So for a better understanding of this test, we assume an example. suppose there are 2 classes in a school with 50-50 students in each class. let’s just say we want to perform the permutation test on the mean difference of heights of students of both classes 1 and 2. and we want to calculate the P-value for the mean difference of heights of students of both classes.
Step 1:
let’s assume the heights of students of class1 is cl_1 = [ a1, a2, a3, a4…………..a50 ]
and the mean value of heights of class1 students is mu1,
and the the heights of students of class2 is cl_2 = [ b1, b2, b3, b4…………..b50 ]
and the mean value of heights of class1 students is mu2,
so the difference of means of heights of students is
μ2 – μ1 = Δ
Created in Paint
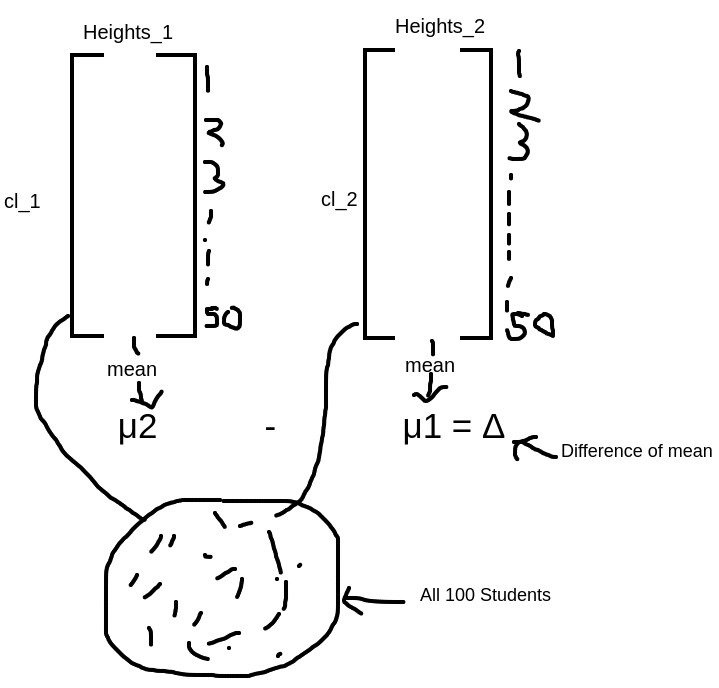
Step 2:
In the next step, we mix all the heights of students and create a new random variable X, and put all the heights in the random variable X.
X = [ Heights of 100 students ]
Now in this step, we make our new data sample, so we randomly select 50 value from X and put it into variable 1_cl_1, and then we put the remaining 50 heights in variable 1_cl_2.
1_cl_1 = [ random 50 heights from X ]
1_cl_2 = [ remaining 50 heights from X ]
now we calculate the difference of means from this two (1_cl_1, 1_cl_2) classes,
1_μ2 – 1_μ1 = d1
Created in Paint
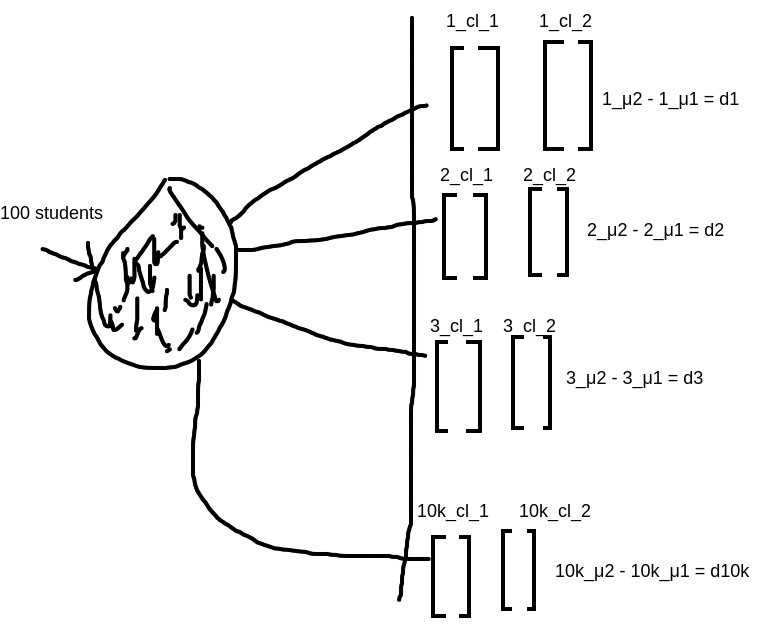
Step 3:
Now we repeat step 2, about 10k times so,
2_cl_1 = [ random 50 heights from X ], 2_cl_2 = [ remaining 50 heights from X ]
2_μ2 – 2_μ1 = d2
3_cl_1 = [ random 50 heights from X ], 3_cl_2 = [ remaining 50 heights from X ]
3_μ2 – 3_μ1 = d3
………………………………………..
………………………………………..
10k_cl_1 = [ random 50 heights from X ], 10k_cl_2 = [ remaining 50 heights from X ]
10k_μ2 – 10k_μ1 = d10k
Step 4:
In this step, we sort our all d1, d2, d3………d10k,
so then it becomes d1*, d2*, d3*, ……………, d10k*, let’s call it Z.
Step 5:
So now we put our Δ in the Z, so the Δ is somewhere lies in the Z,
Z = [ d1*, d2*, d3*, ……..Δ……., d10k* ]
now we trying to find that how much % of the point is greater than our Δ in the Z variable. let’s assume that there is 5% of the data point is greater than Δ so the P-value for the mean difference of heights of students of both classes would be 5%.
P-value = How much % of data points of Z variable is greater than Δ
Errors in Hypothesis Testing:
Now let’s talk about the Errors of hypothesis testing. the errors in hypothesis testing are nothing but our biases towards either null hypothesis or alternative hypothesis. whenever we reject a hypothesis even after proving it to be true, then hypothesis errors come in this situation. now let’s talk about the errors in hypothesis testing, then there are two types of errors in hypothesis testing called Type 1 Error and Type 2 Error. so let’s talk about them one by one,
.png)
Type 1 Error:
The Type 1 Error occurs when we reject the null hypothesis even after it is proved to be true. This means whenever we do hypothesis testing and our null hypothesis proved to be correct, but because of our personal biases, we reject the null hypothesis then the Type 1 Error occurs. the consequences of type 1 error are bigger. type 1 error makes a bigger impact.
For example, let’s assume that you make a claim that tomorrow the stock price will be the highest in the market. here the alternate statements or hypotheses would be something like this,
H0 = The stock prices will not increase tomorrow
H1 = The stock prices will increase tomorrow
Now if we do hypothesis testing and the null hypothesis is proved to be correct, but due to lack of data and on the basis of our past experience, if we reject the null hypothesis, then there will be a type 1 error.
Type 2 Error:
The Type 2 Error occurs when we reject the alternative hypothesis even after it is proved to be true. This means whenever we do hypothesis testing and our alternative hypothesis proved to be correct, but because of our personal biases, we reject the alternative hypothesis then the Type 2 Error occurs. the consequences of type 2 errors are lower. type 2 error does not make a bigger impact.
For example, let’s assume that a pharma company claims that their new medicine is more effective than the previous one. so here the alternate statements or hypotheses would be something like this,
H0 = The new medicine is not more effective than the previous one
H1 = The new medicine is more effective than the previous one
Now if we do hypothesis testing and the alternative hypothesis is proved to be correct, but due to lack of data and we don’t want to take the risk because it’s a matter of life and death, because of this if we reject the alternative hypothesis, then there will be a type 2 error.


