An Efficient way of performing EDA- Hypothesis Generation
Introduction-
Once you are done with understanding the problem statement and have your strategy in place, then only look into data. Never dive into the ocean without doing preparation. If you directly look into your data, you would try to find as many patterns possible in it and that process will never end. You won’t know when to stop and will get stuck instead.
Don’t worry, Hypothesis Generation is there to help you out!
What is Hypothesis Generation?
As mentioned in this article,
Hypothesis generation is an educated “guess” of various factors that are impacting the business problem that needs to be solved using machine learning.
In short, you are making wise assumptions as to how certain factors would affect our target variable and in the process that follows, you try to prove and disprove them using various statistical and graphical tools.
This process will save a lot of time. Let me illustrate that with an example.
Example-
The Problem Statement that we are going to solve is-
“Being a Data Scientist in an E-Learning Platform, you have been employed to determine the Course Sales for the upcoming few months so that we find out what our Cash flow is gonna be. This will help us in the allocation of our resources to pay our instructors, for our operations and also, for our expansion.”
Ideally, before looking into the data, just spend one hour and understand the problem statement well. Think about all the factors that would affect the sales of our courses and then look into the data- this will help you in the feature engineering process.1
This is how the Dataset looks like–
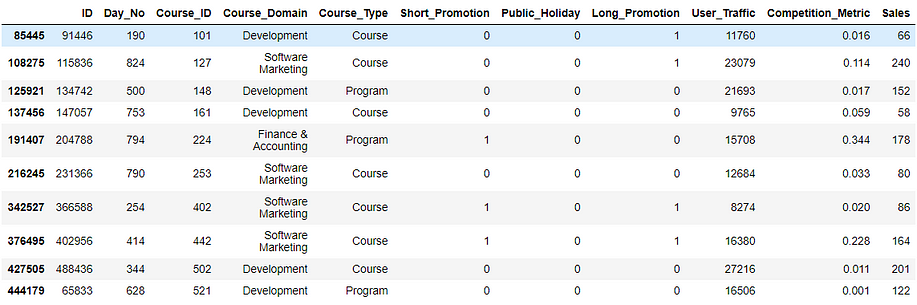
There are 9 features (removing ID) and the target variable- Sales.
First, perform the Univariate analysis to understand each variable. I hope that’s pretty straightforward and not that much time-consuming?
But, the process of Bivariate and Multivariate Analysis which follows could take a lot of time if you try to take up all the possible combinations (⁹C₂=36 combinations for just bivariate) and try to find a relationship between them. Especially when you’re dealing with a hackathon dataset, this process should ideally be performed quickly!
Now, this is how I carried out Bivariate analysis-
While I was doing the Univariate Analysis, I compiled a set of questions which I would then try to prove and disprove using simple visual tools, you might want to choose another way.
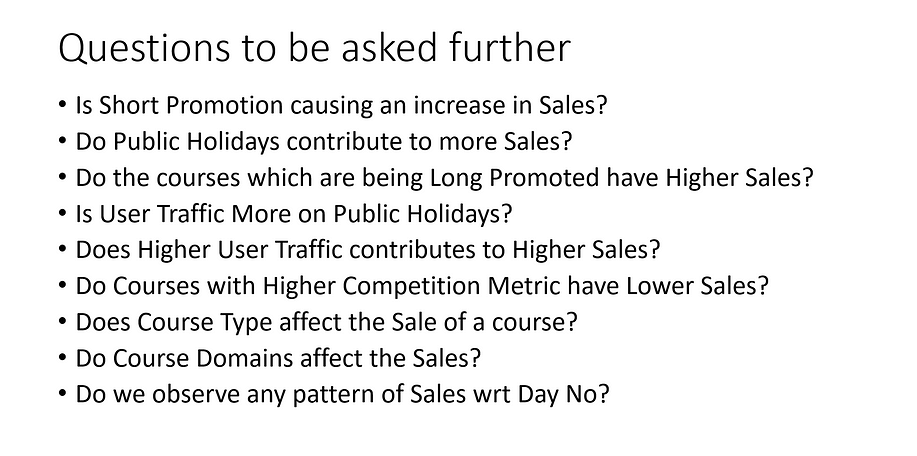
So, these are the questions that would more or less cover our Bivariate Analysis. The visualizations have been made in Python using Matplotlib and Seaborn. They are pretty easy to build as well as interpret.
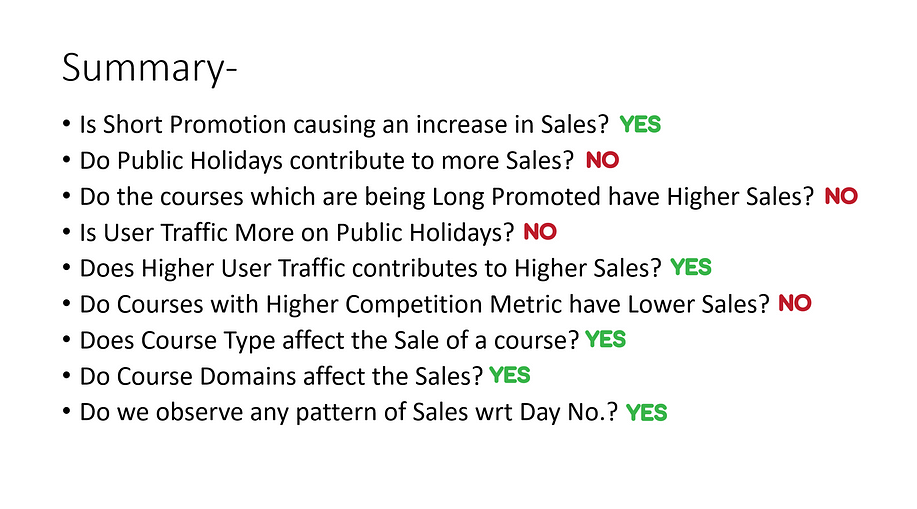
Q1. Is Short Promotion causing an increase in Sales?
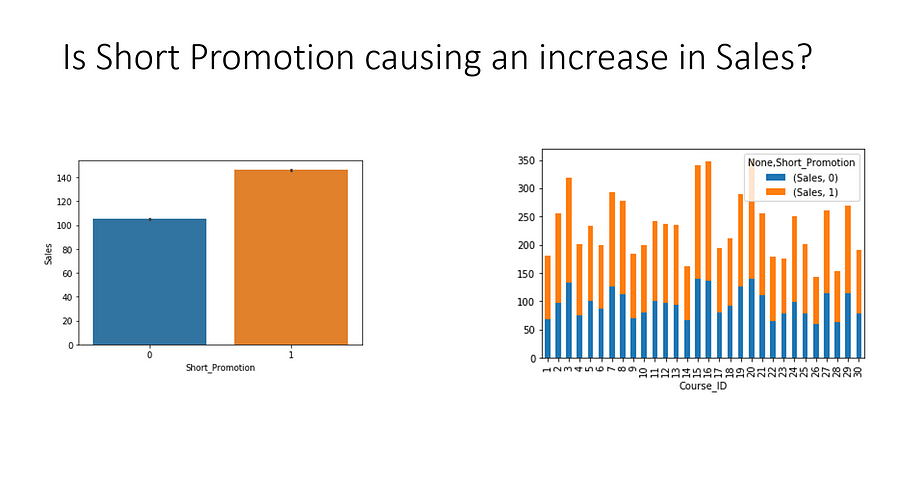
Yes, it is! We can see that there is a difference between Mean Sales when Courses were on Short Promotion and when they were not. You may use a t-test to statistically back your analysis as well rather than just visually doing it.
Q2. Do Public Holidays contribute to More Sales?
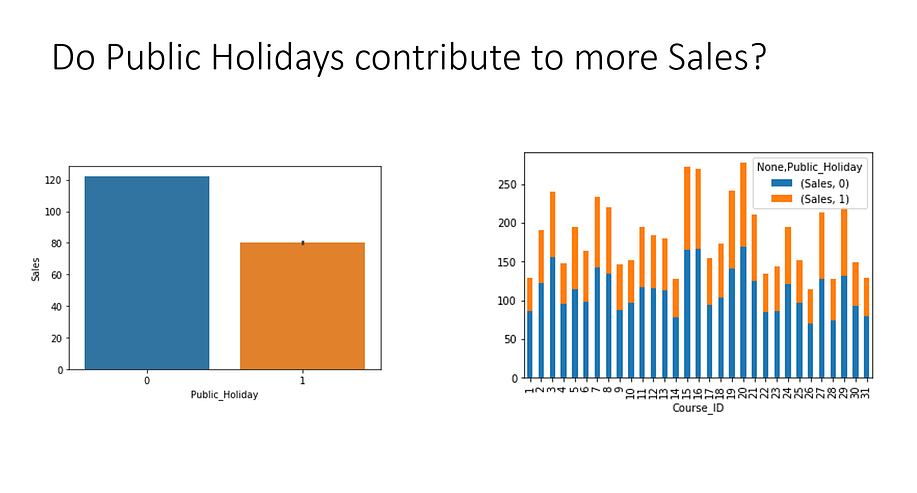
We can see that the Mean Sales on Non-Holidays is more than on Public Holidays. So, No! Public Holidays do not contribute to More Sales.
Q3. Do the courses which are being Long Promoted have Higher Sales?
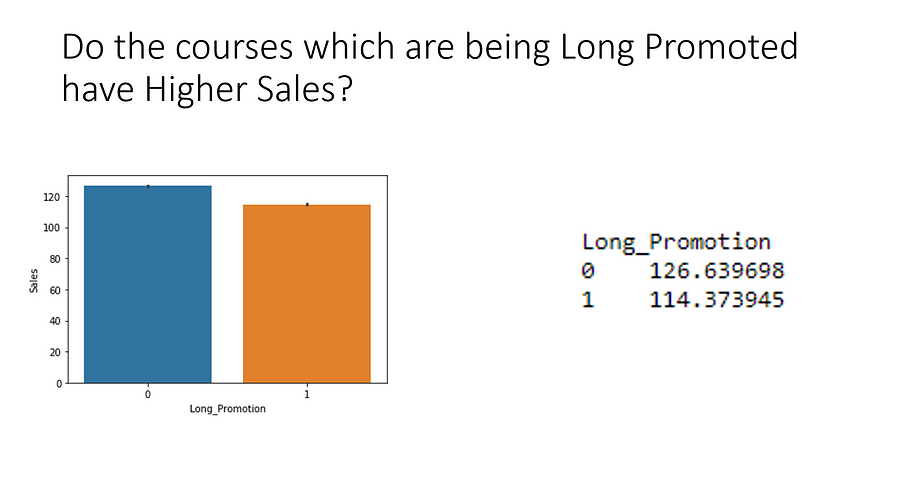
Again, the mean sales under Long Promotion is less than when it is not under long promotion. So, we can say that Long Promotions do not help increase our sales. Hence, No!
Q4. Is User Traffic More on Public Holidays?
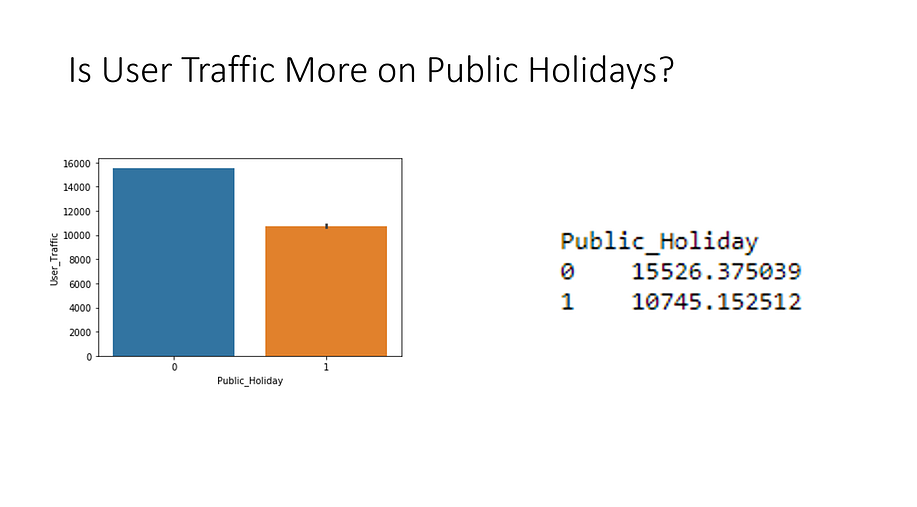
No! In fact, User Traffic is lesser on Public Holidays. People don’t visit prefer to buy courses on holidays xD
Q5. Does Higher User Traffic contribute to Higher Sales?
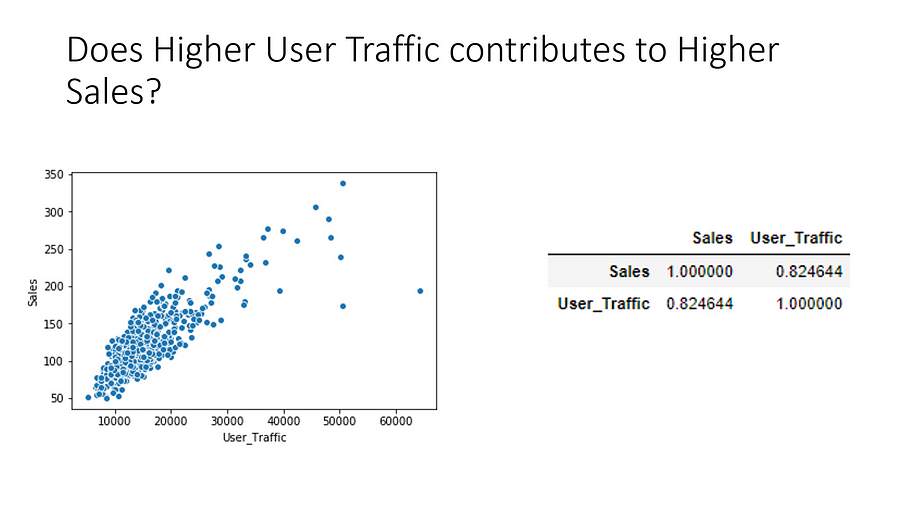
After looking at the scatter plot and obviously the correlation value, we can see that higher User Traffic leads to higher Sales. So, Yes! Higher User Traffic significantly affects our target variable.
Q6. Do Courses with Higher Competition Metric have Lower Sales?
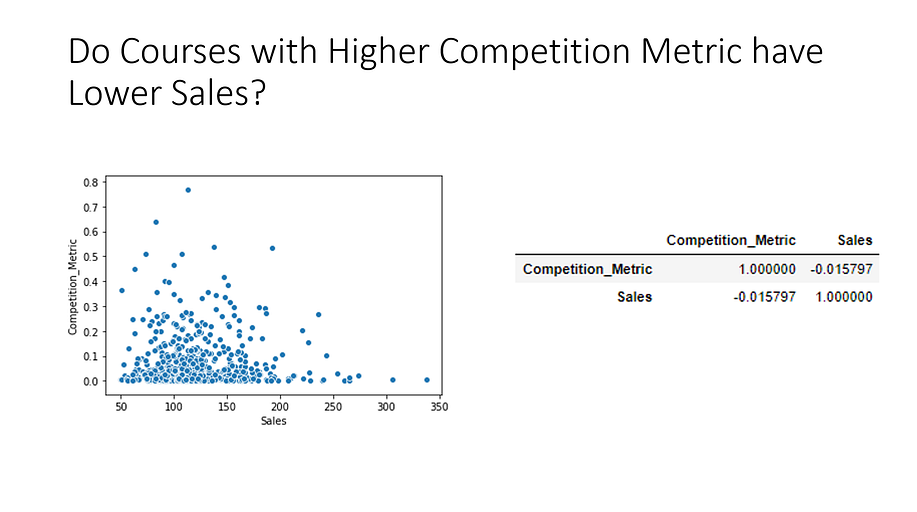
No! Looking at the correlation value (-0.015), we can say that Competition_Metric hardly has any effect on Sales. Instead, it slightly decreases it.
Q7. Does Course Type affect the Sale of a course?
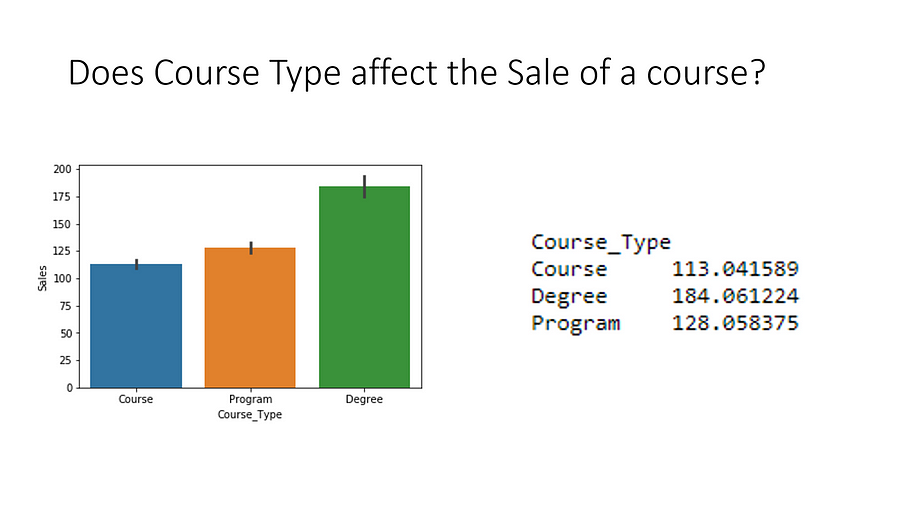
Yes! The Bar Plot clearly shows that Degrees have much higher sales than Course and Programs.
Q8. Do Course Domains Affect Sales?

Yes! Business courses have a much higher mean than others. So, Course Domain affects Sales. But, do you see that the black line going through Business is much bigger than the rest? This implies that the variance of Sales of Business courses is much larger. To further confirm whether Course Domains affect the Sales, you may perform ANOVA or T-test.
Q9. Do we observe any pattern of Sales w.r.t. Day No.?

To answer this question we draw two line plots with Sales on the y-axis and Days on the x-axis in the first chart and Weeks in the second chart. We observe a bi-weekly pattern through the first plot and a yearly seasonal pattern through the second.
Voila! This is how our Analysis turned out to be-
Conclusion-
Wasn’t it quick? Once we performed the Hypothesis generation, it hardly took any time to carry out further analysis.
And that is the beauty of planning, my friends. (Aha! I just gave you a life lesson! xD)
I am sure you would have some different ways of doing EDA and I would love to hear it from you. You can contact me on LinkedIn or we can discuss it in the comments below!
Thanks for staying till the end.
LinkedIn- https://www.linkedin.com/in/iasarthak/
GitHub- https://github.com/iasarthak


Love this! Pretty well described, a lot of beginners struggle with it, more so on the time allocation part - thanks for this!