Making Sense of Astronomical Valuation of Tesla
This article was published as a part of the Data Science Blogathon.
Opinions on Tesla Price ($672, $677B Market Cap)
It is fair to say that Tesla is one of the most polarizing stocks of our time. On TipRanks, the 1-year prediction of the stock price ranges from a low of $67 to a high of $1,200. That is a staggering difference of about 20x. Even when looking for guidance from the most esteemed analysts of our time, we get extremely polarized views.
・”What do $TSLA, $BTC, option gamma traders have in common? Rhymes with Rubble” — Michael Burry (Legendary Big Short Investor), 11/2020
・”Our confidence in Tesla has been rising. With their improvements and leadership in autonomous vehicles, battery technology, AI.” — Cathie Woods (ARK Invest CEO), 02/2021
Yet, Tesla continues to be a company that is difficult to grasp due to its unpredictable moves: shocking purchase of $1.5bn Bitcoin, continuous controversial tweets from Elon Musk, and news about their blowout earnings in Q12021.
This made me want to look at the actual key metrics of Tesla’s valuations and how it compares to other companies. I aim to explore how exactly outrageous Tesla’s stock price is compared to other companies.
Methodology (Scraping with Python Finance API)
1. Collecting a basket of companies to compare Tesla
I have decided to use a list of 60 companies from the Healthcare, Technology, and Automotive Industry. The market capitalization of these companies is mostly over $100bn, making them large caps.
I wanted to include both the Technology and Automotive Industry, because Tesla is always argued to encompass both sectors, and I also wanted to add another unrelated industry (Healthcare) to give it some more ground for comparison.
The full list of the ticker symbols used for the analysis is below:
['AAPL', 'MSFT', 'MSF.BR', 'TSM', 'NVDA', 'ASML', 'INCO.BR', 'INTC', 'ADBE', 'ASML.AS', 'ORCL', 'CSCO', 'CIS.BR', 'CRM', 'AVGO', 'ACN', 'TXN', 'SHOP.TO', 'SAP', 'QCOM', 'SHOP', 'SONY', 'IBM', 'AMAT', 'INTU', 'SQ', 'NOW', 'UBER', 'MU', 'JNJ', 'UNH', 'RO.SW', 'PFE', 'ABT', 'MRK', 'NVS', 'ABBV', 'TMO', 'LLY', 'DHR', 'MDT', 'NVO', 'MRK.PA', 'AMGN', 'BMY', 'AZN', 'SNY', 'SAN.PA', 'ISRG', 'CVS', 'SYK', 'TSLA', 'F', 'GM', 'VWAGY', 'TM', 'HMC']
2. Comparing key valuation metrics of Tesla with other companies
To understand Tesla’s valuations, I have decided to use market capitalization and PSR (Price-to-sales ratio). PSR is calculated by taking a companies’ market capitalization divided by its revenue.
I decided not to use the P/E (price to earnings ratio) because some high-growth companies do not yet have earnings.
To extract the metrics, I will use a great finance API called fmpcloud. You can get a free API for a daily limit of 250 calls.
After you create a list of the stocks you want to analyze, you can iterate over each stock to get the key metrics using the code below. I have used Jose Manu’s code as a reference that he introduces in this article.
With the below code we can get various key metrics
・Operational metrics (all annual): Gross Profit Ratio, Operating Income Ratio, Net Income Ratio, Revenue, Revenue Growth, EBITDA Growth
・Financial metrics: Market Capitalization, Price-To-Sales Ratio
import pandas as pd
import numpy as np
import pandas_datareader as web
from matplotlib import pyplot as plt
%matplotlib inline
from datetime import datetime
from pandasgui import show
import requests
import json
database = ['AAPL', 'MSFT', 'MSF.BR', 'TSM', 'NVDA', 'ASML', 'INCO.BR', 'INTC', 'ADBE', 'ASML.AS', 'ORCL', 'CSCO', 'CIS.BR', 'CRM', 'AVGO', 'ACN', 'TXN', 'SHOP.TO', 'SAP', 'QCOM', 'SHOP', 'SONY', 'IBM', 'AMAT', 'INTU', 'SQ', 'NOW', 'UBER', 'MU', 'JNJ', 'UNH', 'RO.SW', 'PFE', 'ABT', 'MRK', 'NVS', 'ABBV', 'TMO', 'LLY', 'DHR', 'MDT', 'NVO', 'MRK.PA', 'AMGN', 'BMY', 'AZN', 'SNY', 'SAN.PA', 'ISRG', 'CVS', 'SYK', 'TSLA', 'F', 'GM', 'VWAGY', 'TM', 'HMC', "TWTR", "FB", "GOOGL"]
demo = yourapikey
pricetosales = {}
#database includes the list of companies mentioned above
for item in database:
    try:
      IS = requests.get(f'https://fmpcloud.io/api/v3/income-statement/{item}?apikey={demo}')
      IS = IS.json()
      Revenue = IS[0]['revenue']
      grossprofitratio = IS[0]['grossProfitRatio']
      operatingprofitratio = IS[0]['operatingIncomeRatio']
      netincomeratio = IS[0]['netIncomeRatio']
      #most recent market capitliazation
      MarketCapit = requests.get(f'https://fmpcloud.io/api/v3/market-capitalization/{item}?apikey={demo}')
      MarketCapit = MarketCapit.json()
      MarketCapit = MarketCapit[0]['marketCap']
      #company sector
      Sector = requests.get(f"https://fmpcloud.io/api/v3/profile/{item}?apikey={demo}")
      Sector = Sector.json()
      Sector_Name = Sector[0]["sector"]
      Industry = Sector[0]["industry"]
      Symbol = Sector[0]["symbol"]
      Beta = Sector[0]["beta"]
      #growth rate
      Growth = requests.get(f"https://fmpcloud.io/api/v3/income-statement-growth/{item}?limit=40&apikey={demo}")
      Growth = Growth.json()
      Rev_growth = Growth[0]["growthRevenue"]
      EBITDA_growth = Growth[0]["growthEBITDA"]

      #Price to sales
      p_to_sales = MarketCapit/Revenue
pricetosales[item] = {}
      pricetosales[item]["Symbol"] = Symbol
      pricetosales[item]["Beta"] = Beta
      pricetosales[item]['revenue'] = Revenue
      pricetosales[item]['Gross_Profit_ratio'] = grossprofitratio
      pricetosales[item]['price_to_sales'] = p_to_sales
      pricetosales[item]['Market_Capit'] = MarketCapit
      pricetosales[item]['sector'] = Sector_Name
      pricetosales[item]['industry'] = Industry]
pricetosales[item]["Operating_Profit_ratio"] = operatingprofitratio
      pricetosales[item]["Annual_Revenue_Growth"] = Rev_growth
      pricetosales[item]["Annual_EBITDA_Growth"] = EBITDA_growth
    except:
      pass
3. Try to make sense of the high valuations Tesla given their underlying business
After collecting the necessary information about Tesla’s valuation in comparison with other companies, I wanted to use operational metrics (profitability, size, and growth) to make sense of Tesla’s valuations.
Analysis and Drawing Insights
Insight #1: Tesla’s valuation is definitely on the hefty side. But so is the semiconductor industry.
Typically a SaaS company has a revenue multiple of 10, which is where Apple, Google, Facebook all lying around.
In comparison, you can see that Tesla’s PSR is over 20 (PSR of 23.1), which is twice GAFA’s. Looking down the list, however, you can see that Nvidia (NVDA) and ASML also have a PSR close to the 20s.
This shows that the semiconductor industry also enjoys high valuations. On the other hand, healthcare is valued quite low.
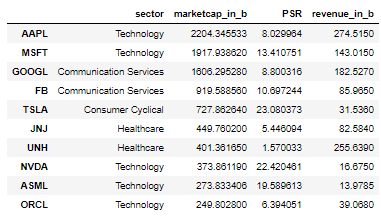
Created by Author, Analyzing Top 10 Market Cap stocks
Insight #2: Tesla’s profitability is definitely not a good justification of the high valuation.
The below graphs compare a company’s PSR with Gross Profit and Operating Profit Margin. Each bubble represents a company.
You can see the positive correlation between profitability and PSR, suggesting that the higher the profitability, the higher the valuations.
However, Tesla goes against this trend, as an obvious outlier. Other automotive companies (blue) have similar profitability but their PSRs are 1/20th of that of Tesla.
By the way, there is one company with a whopping PSR of over 50. It is Shopify, which is absolutely incredible.
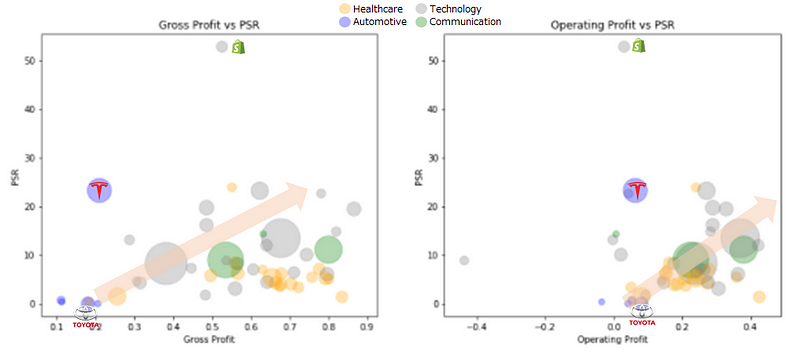
Created by Author, PSR vs Profitability, Bubble Size = Market Cap
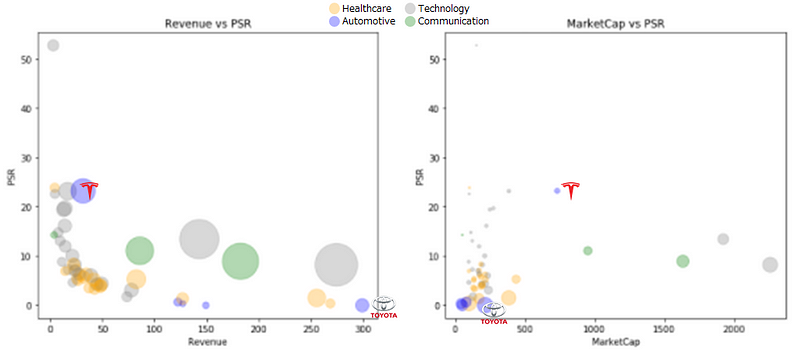
Insight #3: Tesla’s business size (market cap and revenue) isn’t either.
The below graphs compare a company’s PSR with Revenue and Operating Profit.
When looking at revenue (left), you can see that Tesla’s PSR is high compared to other companies with a similar revenue (~$30bn). Also, Tesla has a high PSR considering its market cap of over ~$500bn.
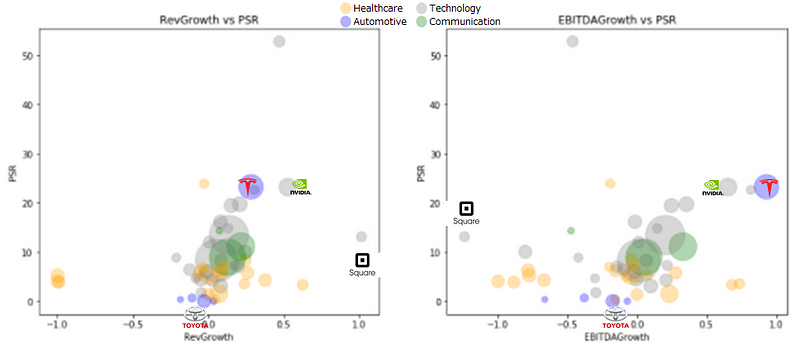
Insight #4: Tesla’s high growth rate (in profits & revenue) starts to justify the valuations.
The below graphs compare a company’s PSR with Revenue Growth and EBITDA Growth.
When looking at Revenue Growth (left), you can see that Tesla’s revenue growth is quite high compared to other companies. In the automotive industry, they have all experienced negative revenue growth while Tesla is growing at about 30%.
It is quite remarkable to see Tesla’s growth despite the pandemic and semiconductor shortage.
Also when looking at EBITDA Growth, you can see Tesla’s growth is by far the highest. I believe that Tesla’s valuation soared to a great degree due to it reaching a profitable business model (I understand there is debate about this too due to the revenues in regulatory credits).
On a small note, you can see that Shopify’s valuation is truly the one that is the most astronomical.
Final Thoughts
In conclusion, I believe the charts help to show the degree to how Tesla’s valuation stands out in comparison to other companies. With its current profitability and growth, Tesla’s valuation is definitely high. Which makes it a difficult buy for investors, especially for institutions.
But you cannot deny that Tesla’s growth is nothing short of remarkable. When looking at the overall picture, Tesla is still at a very early stage of its lifecycle with most of its growth and technology yet to unfold.
Ramp-up of vehicles, autonomous technology, solar energy business, and the development of an AI platform, are all still in the making.
I believe upcoming earnings will continue to blow out expectations. An interesting quote is hidden in the 10-Q of their FY2021 Q1 earnings:
During the first quarter of 2021, the operational milestone of annualized revenue of $55.0 billion became probable of being achieved and consequently, we recognized a catch-up expense of $116 million.
This suggests that Tesla is fairly confident to reach a revenue of $55bn in 2021. This is a revenue growth rate of 77% from $31bn in 2020. Wow.
However, value is truly in the eye of the beholder. You can walk away from the hefty valuations or buy into the disruptive growth promised by Elon. For this reason, Tesla is and will continue to be a company with strong disagreements.
The media shown in this article are not owned by Analytics Vidhya and is used at the Author’s discretion.


