Automated Spam E-mail Detection Model(Using common NLP tasks)
Hope you all are doing Good !!! Welcome to my blog!

Today we are going to understand about basics of NLP with the help of the Email Spam Detection dataset. We see some common NLP tasks that one can perform easily and how one can complete an end-to-end project. Whether you know NLP or not, this guide should help you as a ready reference.
For the dataset used click on the above link or here.
Let’s get started,
Natural Language Processing (NLP) is the art and science which helps us extract information from the text and use it in our computations and algorithms.
Problem Statement
We are going to create an automated spam detection model.
1. Importing Libraries and Dataset:
Importing necessary libraries is the first step of any project.
NOTE: When starting an NLP project for the first time always remember to install an NLTK package and import some useful libraries from this package. Below are some examples:
import wordcloud
import nltk
from nltk.corpus import stopwords
nltk.download('stopwords')
nltk.download('wordnet')
nltk.download('punkt')
nltk.download('averaged_perceptron_tagger')
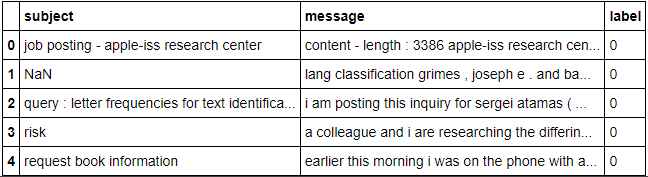
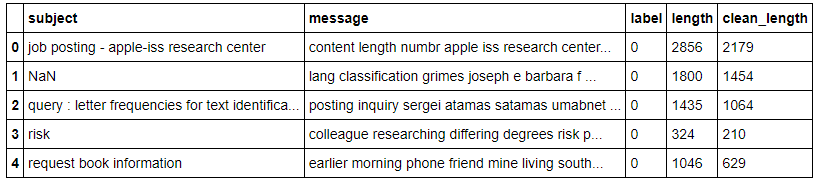
Then we move on to the second step i.e. loading the dataset on which we have to have to work and after that convert it into pandas DataFrame from csv format. Now check it with the top five rows.
df = pd.read_csv("messages.csv",encoding='latin-1')
df.head()
2. Data Pre-processing:
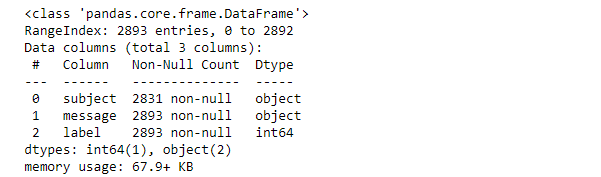
In this step, we explore data and gain insights such as shape, accuracy, and initial patterns in the data.
First, we check the information of the given dataset and extract information about the dataset. And we see that the dataset contains 2893 entries with no NaN values in the feature message & label.
However, we have 62 missing rows in the subject column that means 62 emails are without a subject heading. But here, not dropping these rows as it is of no use in building our model.
df.info()
Now we check the spam and non-spam emails in the dataset.
print("Count of label:n",df['label'].value_counts())
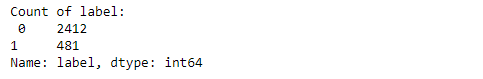
Here, we see that 1 stand for Spam mail and 0 stand for not a spam mail.
Proceeding with Checking Ratio or percentage of Labels i.e. Spam and Non-Spam emails and observe that 17% mails are Spam emails and rest 83% are Not a Spam emails.
print("Not a Spam Email Ratio i.e. 0 label:",round(len(df[df['label']==0])/len(df['label']),2)*100,"%")
print("Spam Email Ratio that is 1 label:",round(len(df[df['label']==1])/len(df['label']),2)*100,"%")

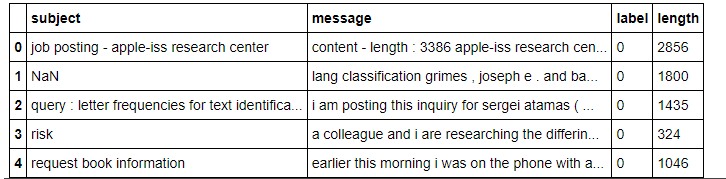
Now we create a new feature named length to check the length of each message and convert every alphabet to lower case in the message.
df['length'] = df.message.str.len()
df.head()
Output :
Besides all these steps, now we do some common tasks that can be done on every NLP project.
We have to clean the data using regex, matching patterns in the e-mail messages, and replace them with more organized counterparts. Cleaner data leads to a more efficient model and higher accuracy. Following steps are involved in pre-processing the messages :
1.) Replace email address
2.) Replace URLs
3.) Replace currency symbols
4.) Replace 10 digits phone numbers (formats include parenthesis, spaces, no spaces, dashes)
5.) Replace numeric characters
6.) Removing punctuation
7.) Replace whitespace between terms with a single space
8.) Remove leading and trailing whitespace
It’s time to do tokenization. Now, what is Tokenization?
Tokenization is a critical step in NLP. We cannot simply jump into the model-building part without cleaning the text first. It is done by removing stop words.
9.) Removing Stop Words: There is a corpus of stop words, that are high-frequency words such as “the”, “to” and “also”, and that we sometimes want to liter out of a document before further processing. Stop-words usually have little lexical content, do not alter the general meaning of a sentence and their presence in a text fails to distinguish it from other texts.
After removing stop words, we have to create another feature named clean_length to compare the cleaned message length with unprocessed message length.
import string
import nltk
from nltk.corpus import stopwords

stop_words = set(stopwords.words('english') + ['u', 'ü', 'ur', '4', '2', 'im', 'dont', 'doin', 'ure'])

df['message'] = df['message'].apply(lambda x: " ".join(term for term in x.split() if term not in stop_words))
Output :
Now checking some information about lengths :
#Total length removal
print("Original Length:",df.length.sum())
print("Cleaned Length:",df.clean_length.sum())
print("Total Words Removed:",(df.length.sum()) - (df.clean_length.sum()))
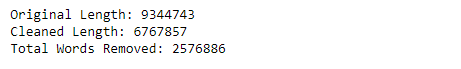
We observed that almost one-third amount of unwanted data is either cleaned or processed after length removal.
3.) Exploratory Data Analysis:
1.)Data visualization: It is the graphical representation of information and data. By using visual elements like charts, graphs, and maps, data visualization tools provide an accessible way to see and understand trends and patterns in data.
a) Counting the number of labels(‘Spam and non-spam counts’) :
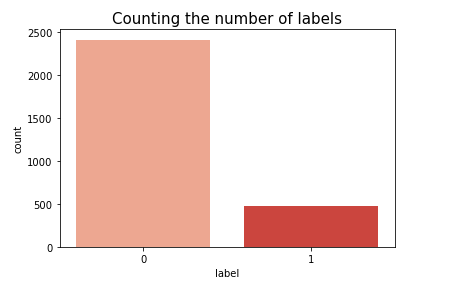
NOTE: In our dataset, 1 stand for Spam emails, and 0 stand for non-spam emails.
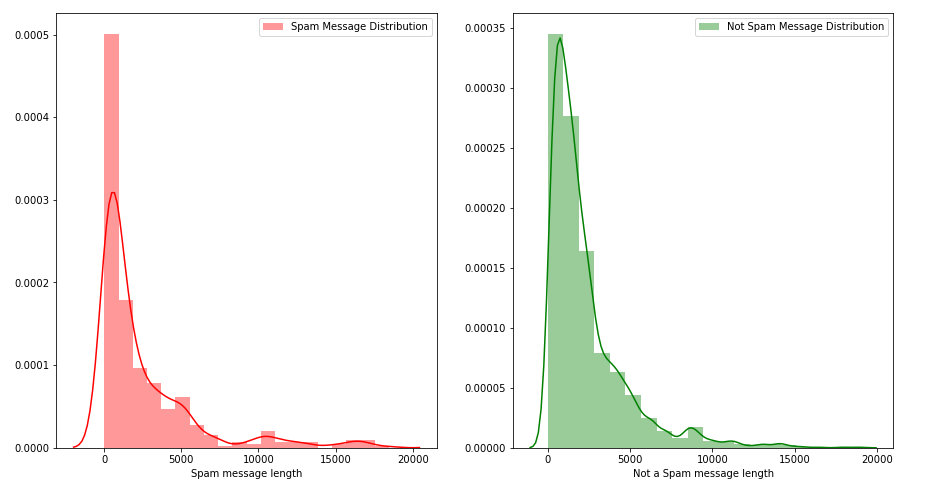
b) Message Distribution before cleaning :
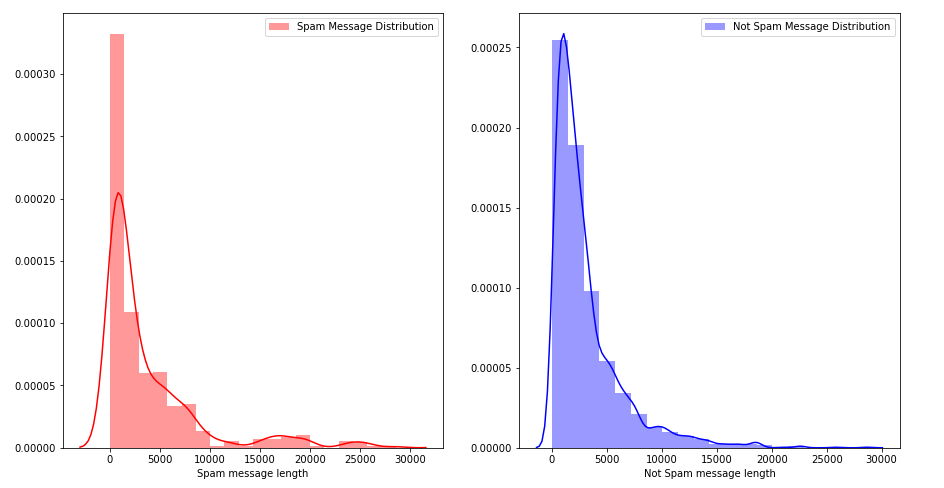
c) Message Distribution after cleaning :
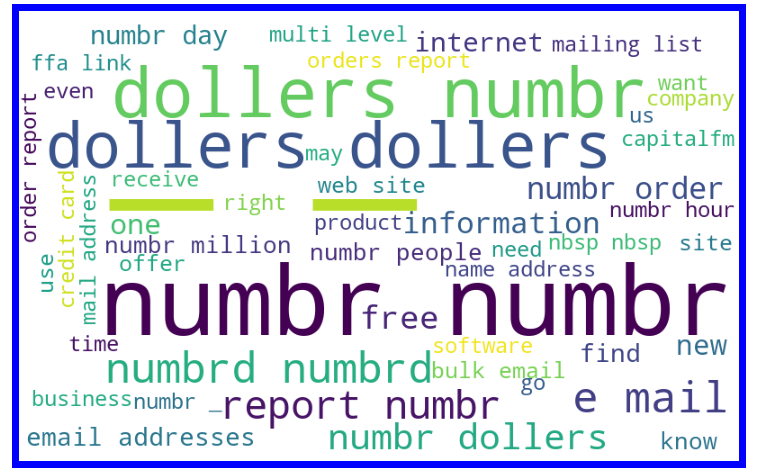
Let’s visualize some popular terms in spam messages using a word cloud. The word cloud library in NLTK will be used for this purpose.
Word Cloud is a data visualization technique used for representing text data in which the size of each word indicates its frequency or importance.
Getting a sense of loud words in Spam email messages :
We have our processed data ready for the modeling.
4.) Run and Evaluate selected models:
1.) We use the Tf-idf vectorizer to convert the alphabetical messages into numeric form.
2.) After vectorizing the messages, we fit and feed them as input for the model and feature label as output.
3.) Here, I’m using two algorithms Naïve Bayes and SVM to compare the accuracy percentage.
4.) In Naïve Bayes, the accuracy percentage raised from 83% to max 88% even after minimizing the test size in the train test split.
5.) But in SVM the accuracy percentage went up to 98% showing better results than Naïve Bayes.
SVM with parameters : ( C=1.0 , kernel = ‘linear’, degree=3 , gamma=’auto’ )
6.) After applying all the suitable algorithms on the dataset we see that SVM is performing better than Naïve Bayes therefore it fits best for our objective.
Hence, all the further process is done in SVM.
tf_vec = TfidfVectorizer()
#naive = MultinomialNB()
SVM = SVC(C=1.0, kernel='linear', degree=3 , gamma='auto')
features = tf_vec.fit_transform(df['message'])
X = features
y = df['label']
print ('Final score = > ', accuracy_score(y_test,y_pred))
5.) Final Results :
Results observed by evaluating the SVM model :

6.) Checking Model prediction:
To check model performance, we will now plot different performance metrics.
a.) Plotted Confusion Matrix:
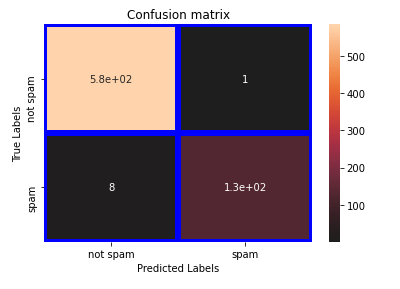
Observation
Confusion Matrix shows high accuracy in predicting true values:
Out of total spam emails, very few are identified as non-spam emails rest all are correctly identified.
We see from above, that the SVM model gives us the best accuracy when performs with all the metrics.
b.) Checking Classification Report:
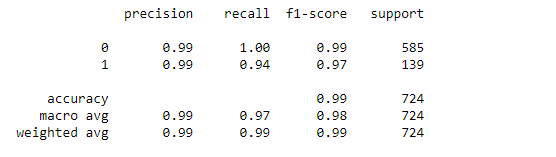
From observation, we found high values ( ~0.99) for accuracy, precision, and recall for the model.
This indicates that the model is a good fit for the prediction.
Concluding Remarks
1.Done all the pre-processing steps to make data ready for model building.
2.Removed stop words and create another feature ‘clean_length’ for comparing cleaned and unprocessed message length.
3. Understood relationship and gain insights by using Data Visualization:
- a. Plotted count plot for checking spam and non-spam email counts.
- b. Message Distribution before and after cleaning.
- c. Lastly, visualize some popular terms in spam messages using the word cloud.
4.Used Tf-idf vectorizer to convert text into vector.
5.Found the best model as SVM which provides max accuracy of 98.75%.
6. Found high precision and recall score of 0.99.
7. Confusion matrix shows high classification accuracy with only 8 out of 481 are incorrect.
8.Overall model fit is good.
Here is the link to my solution:
https://github.com/priyalagarwal27/E-mail-spam-detection
Please leave any suggestions, questions, requests for further clarifications down below in the comment section.
Hope you enjoyed this post, I’d be very grateful if you’d share it. Follow for more blogs!!! Thank you!
For more reading check out my other articles also:
https://github.com/priyalagarwal27/Regression-on-ELECTION-dataset
https://github.com/priyalagarwal27/Crop-Detection-and-Prediction-using-Classification-
https://github.com/priyalagarwal27/Classification—SLOAN-Space-Dataset
Happy Learning !!! Cheers!
About the Author:
Priyal Agarwal
Contact me on Linkedin, Email.
My name is Priyal Agarwal. Recently I've completed a PG program in data science, Machine Learning, and neural networks and I've experienced as a data science intern in Fliprobo technologies, Bangalore as well. I am an enthusiastic, self-motivated, reliable, dedicated and open- minded person. I get across to people and adjust to changes with ease. I believe that a person should work on developing their professional skills and learning new things all the time. For that, I write technical blogs/articles on medium and Analytics Vidhya in contribution to the Data Science Community and learn about new technologies to excel my knowledge.


can please share the dataset used for your testing?