Quick Guide To Perform Hypothesis Testing
This article was published as a part of the Data Science Blogathon.
Introduction

Hypothesis Testing is necessary for almost every sector, it does not limit to Statisticians or Data Scientists. For example, if we develop a code we perform testing too. In the same way, for every product or problem that an organization shows, it has to be solved by providing assumptions. This can be done using “Hypothesis Testing”.
Before going to that, let’s know what exactly Hypothesis means:
“Hypothesis is described as a recommended solution for an undefinable incident which doesn’t into current theory”.
The actual definition of Hypothesis Testing is by which an analyst tests an assumption regarding a population parameter. The methodology retained by the analyst depends on the nature of the data used and the reason for the analysis.
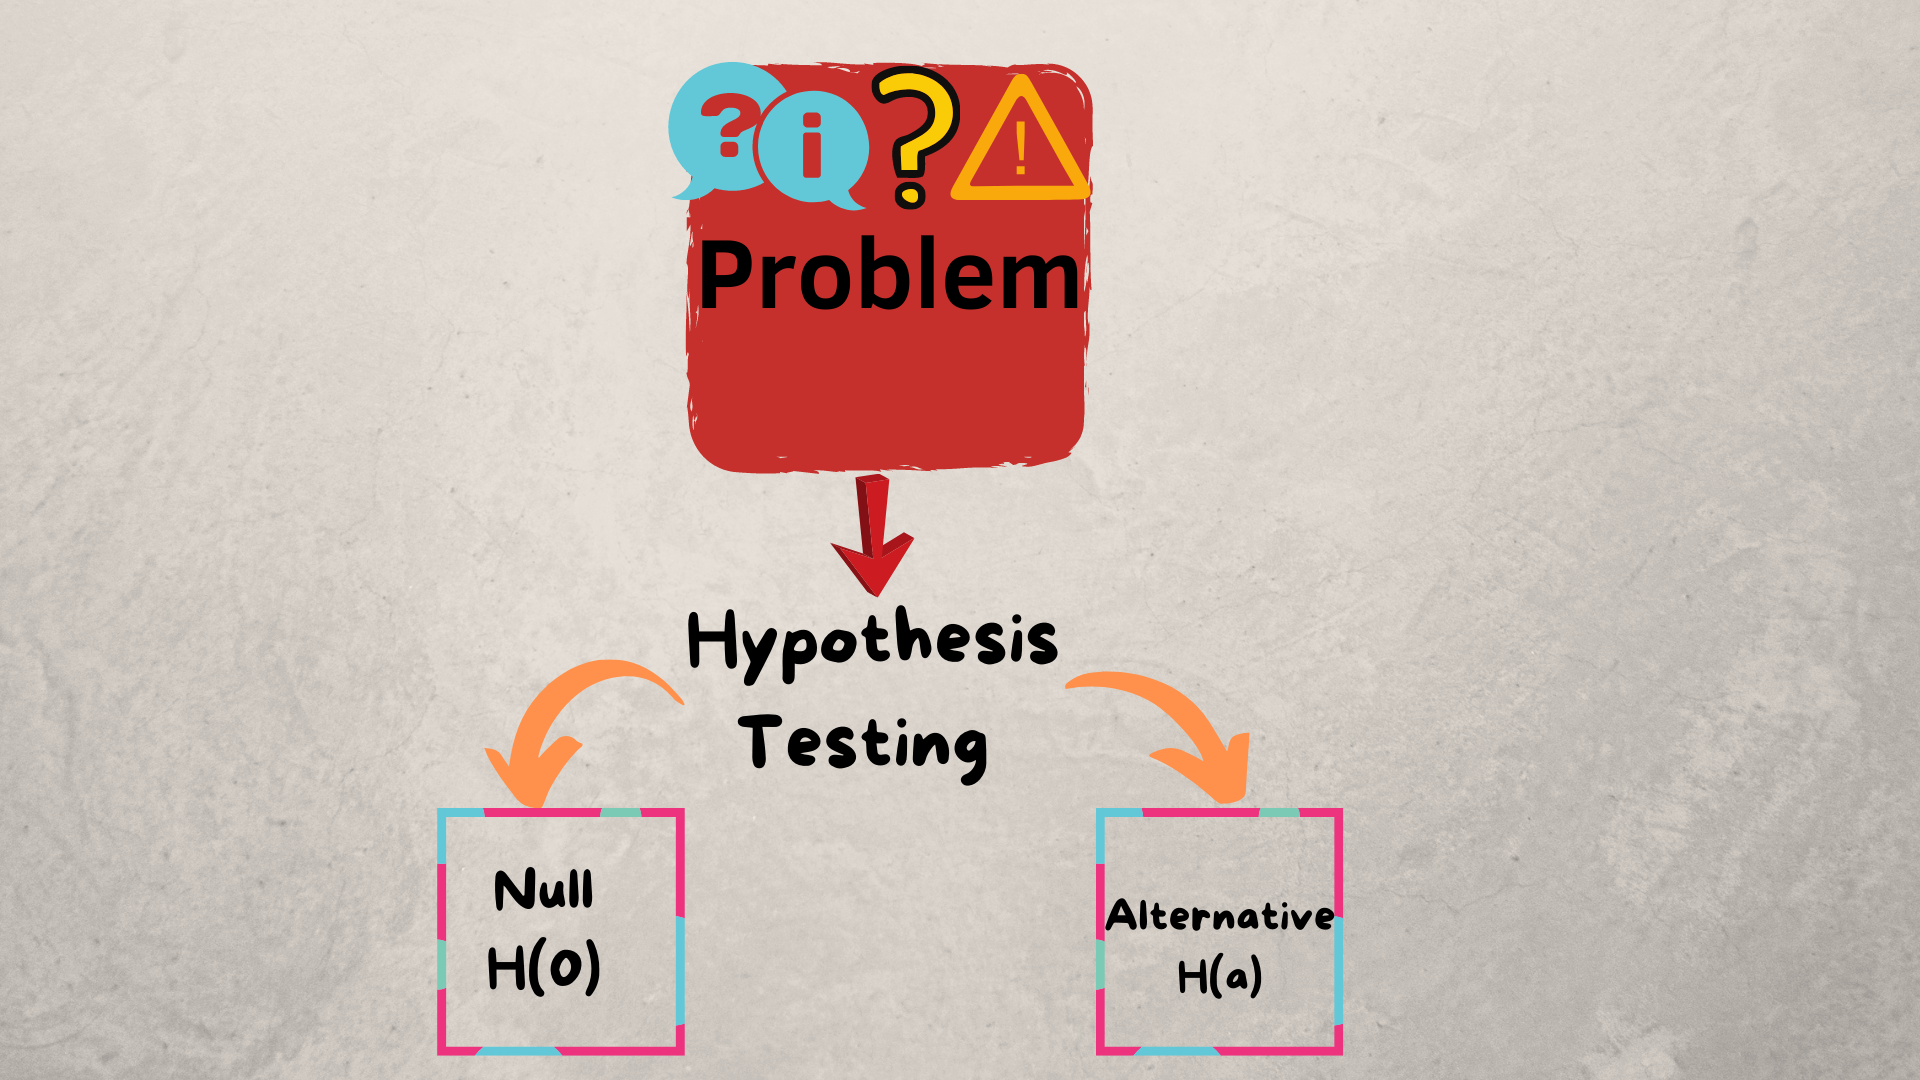
Steps to perform Hypothesis Testing:
-
Define null and alternative hypothesis
-
Examine data, check assumptions
-
Calculate Test Statistic
-
Determine the Corresponding p-value
-
Make a decision about the null hypothesis.
To perform all these steps, let us take an example to understand easily.
Problem: Considering Italian adults from the age group 18-30 living in Italy, Do males have significantly higher mean Body Mass Index (BMI) than females?
Here the population is Italian adults (18-30) in Italy and the parameter of interest is Body Mass Index (BMI)
Step-1: Define Hypotheses
- Null: There is no difference in mean BMI
H(0): U1=U2 [U1 represents the population mean BMI for Males and U2 represents the population mean BMI for females] Here H(0) says that they are equal to each other - Alternative: There is a significant difference in mean BMI
H(A): U1=U2 [U1 represents the population mean BMI for Males and U2 represents the population mean BMI for females] Here H(A) says that they are not equal to each other - Significance level = 5%
Step-2: Examine data and checking assumptions
In this step, the data was filtered to include only Italian adults that were between the ages of 18 and 30. After this, we need to do some statistics calculations like mean, minimum, maximum, standard deviation, and sample sizes for both males and females.
Some of the assumptions that we need to check are as follows:
- Samples are considered simple random samples
- Samples are independent of one another
- Both populations of responses are approximately normal or sample sizes are both large enough.
Step-3: Calculate Test Statistic:
Test Statistic is a measure of how far our sample statistic is from our hypothesized population parameter, in terms of estimated standard errors.
- Z= Best Estimate – null value / Estimated standard error
- The Best Estimate is the difference between the male and female statistic sample mean
- The null value is the hypothesized null value
- The estimated standard error for two means can change depending on which approach we are going to use.
- The two approaches that you can use are the pooled approach and the unpooled approach.
- The pooled approach is the variance of two populations are assumed to be equal.
- The unpooled approach is the assumption of equal variances is dropped.
Step-4: Determining P-value:
P-value is determined by assuming the null hypothesis is true, it is the probability of observing a test statistic of a value(Z) or more extreme.
So we are going to calculate this probability using Z-distribution where df = n1+n2-2
we need to check both sides since it is a two-sided alternative hypothesis because our alternative is not equal too. so, we have to check both the upper and lower tail of our distribution.
The distribution graph looks like given below with its corresponding sample size and the degrees of freedom:
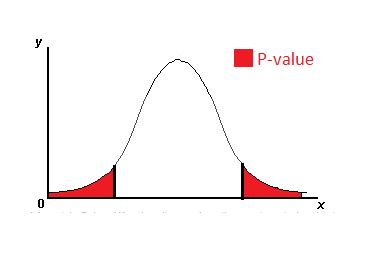
Distribution curve
From the above graph, we can see both our positive test statistic value and below the negative test statistic value. This means that if the difference in population mean BMI between males and females was really zero, so if that null hypothesis was true, then observing a difference in sample means of the test statistic value or something more extreme is fairly likely. There is almost a 20 percent chance of seeing that because this value is so large, we are going to go ahead and fail to reject the null.
Step-5: Make a Decision
If P-value is larger than the significance level, which means there is weak evidence against the null. Thus we fail to reject the null hypothesis.
So, in summary, hypothesis tests are used to put theories about a parameter of interest to the test. Here, that parameter is the difference in population means. The basic steps for performing this hypothesis test. First, we’re going to define our hypotheses. Then, we’re going to examine our data while checking our assumptions and calculating our test statistic. With this test statistic, we’ll determine our corresponding p-value, and then finally, we will make a decision based on this value.
The assumptions for the two-sample t-test for population means are that we need both sets of data to be two simple random samples and they need to be independent of one another. We need to make sure that both populations of responses are normally distributed. If not, we need to make sure we at least have a large sample size so we can apply the central limit theorem. Whether or not our population variances are equal is also crucial in determining whether we use a pooled or unpooled approach. Finally, we need to know how to interpret the p-value, the decision, and our final conclusion. These are all very important when conducting a hypothesis test.
For more articles, do check out this profile:
https://likhithakakanuru.medium.com/


