Understanding K – Means Clustering WIth Customer Segmentation Usecase
This article was published as a part of the Data Science Blogathon
Overview
This article will help us understand the working behind K-means Clustering Algorithm. We will look at the Euclidean Distance Formula and with the help of the formula, we will understand how clusters and centroids within the cluster move.
Introduction
To answer this, let’s read through this page.
Table Of Contents
- What is Clustering?
- Types of Clustering
- What is K-Means Clustering
- The flow of K-Means Algorithm
- Understanding the working behind K-Means
-
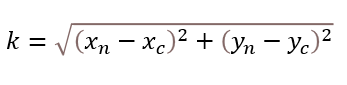
Euclidean Distance Formula
-
Midpoint Formula to Calculate the New Centroid.
-
Implementing K-Means in Python
- Conclusion
1. What is Clustering?
Clustering as a term means grouping identical elements into similar groups or clusters. It can be defined as a process of breaking down the data into groups consisting of similar data points or elements.
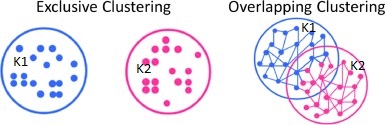
2. Types of Clustering
Exclusive Clustering – Two or more groups or clusters which do not overlap.
Overlapping Clustering – Two or more groups or clusters that overlap.
Hierarchical Clustering – It builds the hierarchy of clusters.
3. What is K-Means Clustering?
K-Means algorithm uses the clustering method to group identical data points in one group and all the data points in that group share common features but are distinct when compared to data points in other groups.
Points in the same group are similar as possible.
Points in different groups are as dissimilar as possible.
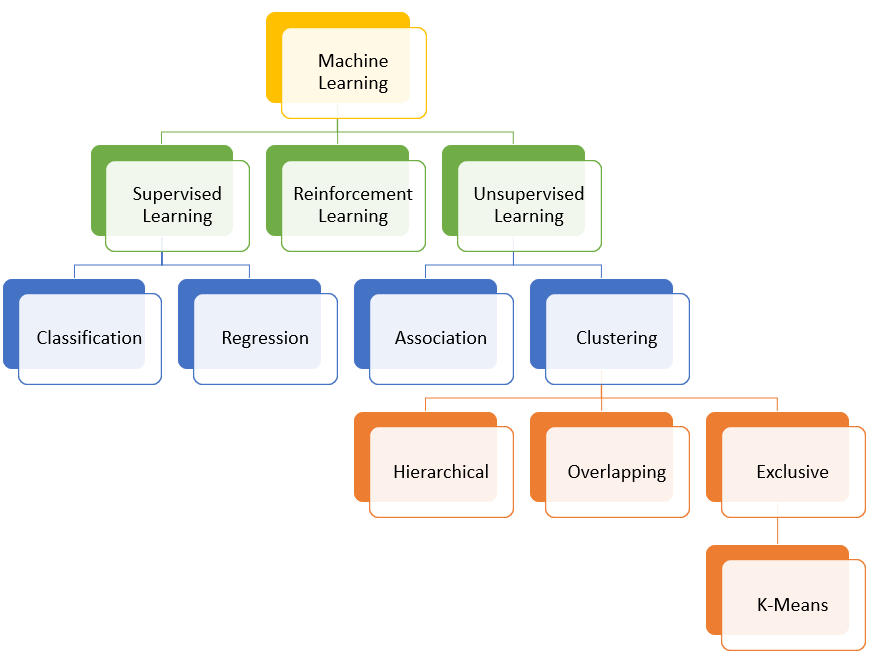
K – Means Clustering falls under Unsupervised Machine Learning Algorithm and is an example of Exclusive Clustering. “K” in K – Means is the number of specified clusters.
Two ways or methods to specify the Number of Clusters in K-Means.
- Elbow Method
- Purpose Based
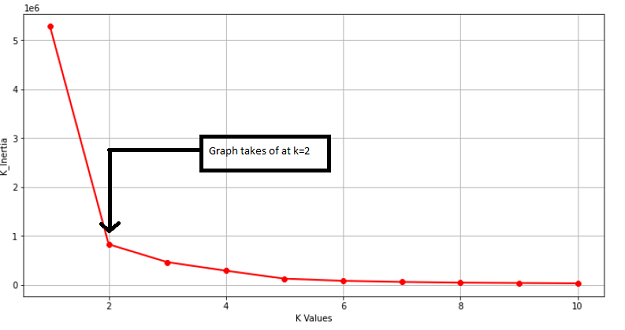
Looking at the below example for the elbow method we can see that at k=2 the Graph changes exponentially, and the point where it changes is taken as the value for the clusters.

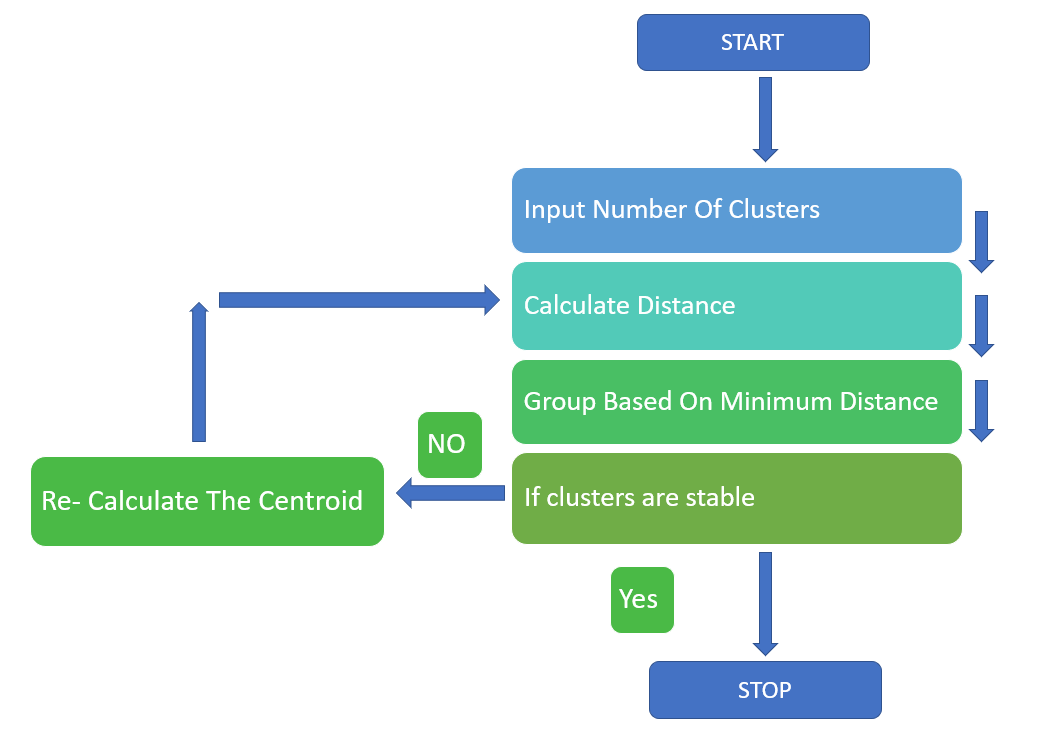
4. The flow Of K-Means Algorithm
- Input the Number of Clusters
- Calculate the Distance of the Data Point from the Cluster Centroid
- Assign the Data Point to the two nearest Cluster
- Re- Calculate the Centroid
- Repeat the process for all the Data Points
5. Understanding the Working behind K-Means.
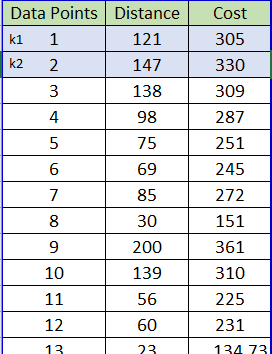
6. Euclidean Distance Formula
7. Midpoint Formula to Calculate the New Centroid.
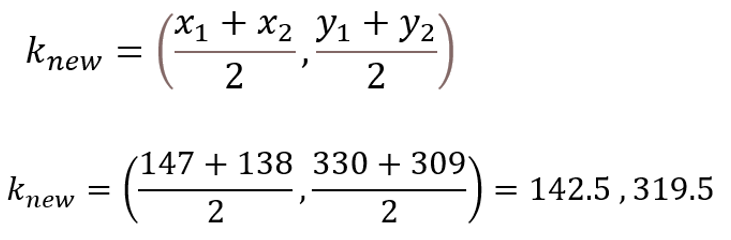
Now the value for the new centroid k2 is (x, y: 142.5, 319.5) and the process is repeated for the other data points.
8. Implementing K-Means in Python
Columns:
Data Points
Distance
Cost
Python Code
# Importing Libraries
import pandas as pd

import numpy as np

import matplotlib.pyplot as plt

import seaborn as sns %matplotlib inline
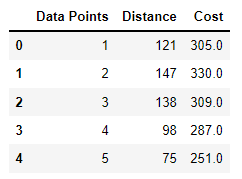
Creating Dataframe using Pandas. Next is to look at the Data and understand it.
# Creating DataFrame
#Reading the File to see the shape, type and Stastics of the Data.
df = pd.read_excel("dat1.xlsx")
df.head()
df.shape
df.describe()
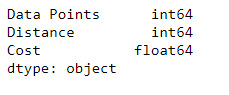
df.dtypes
We can see the top 5 Values from a Data Frame and the data type for the following column’s “Data Points” and “Distance” is an int and for the column “Cost” it is Float.
The Data has 33 Rows and 3 Column’s
Checking for missing values and dropping the “Data Points” column
df.isnull().sum()
df.drop(columns=['Data Points'],inplace = True)
df.head()  # Re-reading the head.
To start with modeling we will create a variable and assign the values from the data to it
#Modelling
# Creating a variable X1 and assigning the values to it.
X1 = df.values
Importing KMeans from Sklearn.
To find the best value for “K” Clusters, we run it in a “for” loop
from sklearn.cluster import KMeans   #Importing KMeans from sklearn and
k_inertia = []                       # Creating a list to store the kmeans.inertia_
for k in range(1,11):
    kmeans = KMeans(n_clusters=k, init='k-means++')
    kmeans.fit(X1)
    k_inertia.append(kmeans.inertia_)
Visualizing from the Graph to find the “K Value” where the change in the K-Means Inertia is negligible and that is the point where the curve shoots up.
K_means inertia is the measurement of how well the clusters have formed by calculating the distance between the Cluster Centroid and the data points in that cluster.
plt.figure(figsize=(12,6))

plt.grid()

plt.plot(range(1,11),k_inertia,linewidth = 2, color = "red", marker = "8")

plt.xlabel('K Values')

plt.ylabel("K_Inertia")

plt.show()
Taking the value of K as 2 that is k = 2 we will fit “kmeans” to the data stored in the Variable X1
kmeans = kmeans(n_clusters=2)
label = kmeans.fit_predict(X1)
print(label)  # To read the cordinates or values of the Cluster Centroids
The below code gives the coordinates of the Cluster centres.
print(kmeans.cluster_centers_) # To plot the visualize the Data Points and the Cluster Centroids.
The scatter plot from matplotlib plots the points. Along the x-axis is the distance and the y-axis has the cost.
plt.scatter(X1[:,0], X1[:,1], c=kmeans.labels_, cmap='rainbow')
plt.scatter(kmeans.cluster_centers_[:,0] ,kmeans.cluster_centers_[:,1], color = 'black')
plt.title('K-Means')
plt.xlabel('Distance')
plt.ylabel('Cost')
plt.show()
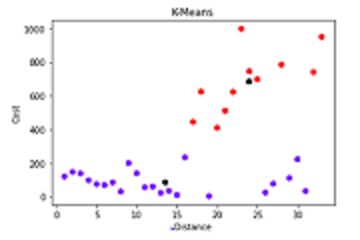
In the above Scatter plot, the Black Dots represents the Centroid and the Purple coloured and Red Colored represents Data Points.
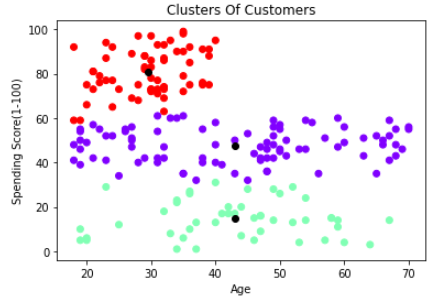
Using the above understanding we will implement K-means for customer segmentation to identify the clusters based on “Age” and “Spending Score”
Steps
Importing Libraries
# Importing Libraries
import numpy as np
import pandas as pd
import matplotlib.pyplot as plt
import seaborn as sns
%matplotlib inline
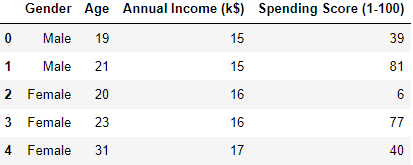
Reading its head that is the top 5 rows and its shape that is, it has 200 rows and 5 Columns. The Data has the following columns: “Customer ID”, “Gender”, “Age”, “Annual Income(k$)”, “Spending Score(1-100)”
df = pd.read_csv("Clustering.csv")

df.head()
To check the number of columns and rows
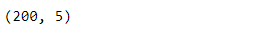
df.shape
The data frame has 200 rows and 5 columns.
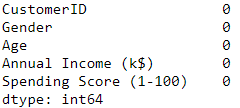
To check for the missing Values
df.isnull().sum()
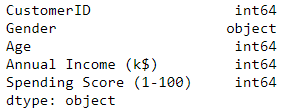
To check the data types
df.dtypes
The data type for the following column’s “Customer ID”, “Age”, “Annual Income (k$)” and “Spending Score (1-100)” is an int and for the column “Age” it is an Object.
Dropping the customer ID column as it is not required and checking the Head.
df.drop(['CustomerID'],axis=1, inplace=True)

df.head()
The “Customer ID” column has been dropped.
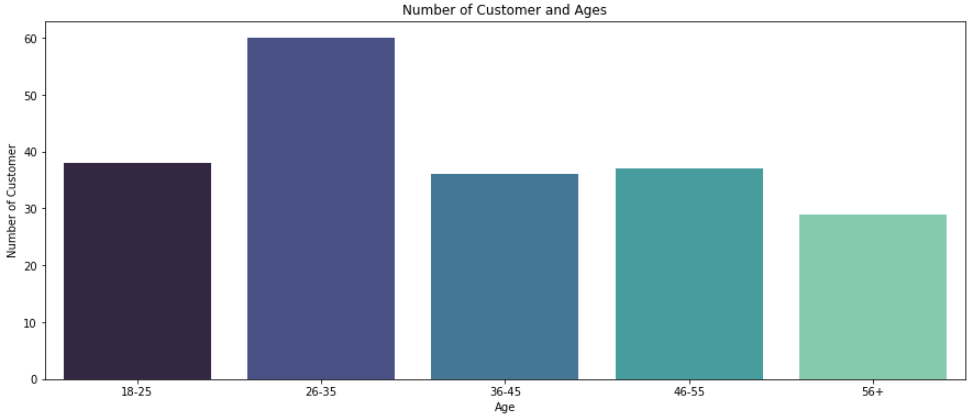
Categorizing the customers based on Age and have divided into 5 groups.
age_18_25 = df['Age'][(df.Age >=18) & (df.Age <= 25)]
age_26_35 = df.Age[(df.Age >=26) & (df.Age <= 35)]
age_36_45 = df.Age[(df.Age >=36) & (df.Age <= 45)]
age_46_55 = df.Age[(df.Age >=46) & (df.Age <= 55)]
age_55above = df.Age[df.Age >=56]
On the x-axis, the customer Age is presented and on the Y-axis number of customer’s are marked
agex = ["18-25","26-35","36-45","46-55","56+"]
agey = [len(age_18_25.values),len(age_26_35.values),len(age_36_45.values),len(age_46_55.values),len(age_55above.values)]
plt.figure(1, figsize=(15,6))                        # Plotting the Graph

sns.barplot(x=agex, y=agey, palette = 'mako')

plt.title('Number of Customer and Ages')

plt.xlabel('Age')

plt.ylabel('Number of Customer')

plt.show()
The same can be repeated for the “Spending score (1 – 100)” Column.
Modelling following the previous example (Segmentation based on ‘Age’ and ‘Spending Score’)
To start with modeling we will create a variable and assign the values from “Age” and “Spending Score (1-100)” to it
X1 = df.loc[:,['Age','Spending Score (1-100)']].values
Importing KMeans from Sklearn.
To find the best value for “K” Clusters we are running it in a “for” loop
from sklearn.cluster import KMeans

age_ss = []

for k in range(1,8):

    kmeans = KMeans(n_clusters=k, init='k-means++')

    kmeans.fit(X1)

    age_ss.append(kmeans.inertia_)

Visualizing from the Graph to find the K Value where the change in the K-Means Inertia is negligible and that is the point where the curve shoots up.


plt.figure(figsize=(12,6))

plt.grid()

plt.plot(range(1,8),age_ss,linewidth = 2, color = "red", marker = "8")

plt.xlabel('K Values')

plt.ylabel("K_Inertia")

plt.show()
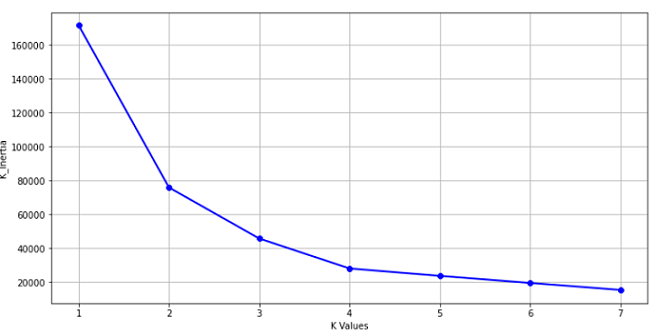
Assigning the value of clusters as 3 that is k = 3
kmeans = KMeans(n_clusters=3)

label = kmeans.fit_predict(X1)

Custer based on Age and Spending Score (Scatter Plot)


plt.scatter(X1[:,0], X1[:,1], c=kmeans.labels_, cmap='rainbow')

plt.scatter(kmeans.cluster_centers_[:,0] ,kmeans.cluster_centers_[:,1], color = 'black')

plt.title('Clusters Of Customers')

plt.xlabel('Age')

plt.ylabel('Spending Score(1-100)')

plt.show()