


Exploratory Data Analysis, or EDA, can be both exhilarating and daunting. Exhilarating because you hold the world at your fingertips — it is exciting to look at a dataset for the first time and begin to imagine all of the interesting insights you might find. It is also extremely daunting to look at a dataset for the first time and not know where to start or worry if the path you decide to take will tell you anything useful at all.
That’s the beauty of EDA — it’s your chance to understand what the data contains, get a feel for what data cleaning is required, and draw conclusions on how useful the data will be for further statistical analysis and/or machine learning. All learnings about your dataset are valuable learnings and, the more EDA you do initially, the more focused and impactful your future analysis will be. Sometimes, the hardest part of anything is starting. But not to worry! In this blog, I will share how to get started performing EDA in Dataiku, highlighting the tools that minimize the time you feel stuck not knowing what to do and maximize the time you spend finding data insights.
EDA With Scooby-Doo
Growing up, I never watched many cartoons, but I have distinct memories of watching Scooby-Doo reruns late into the night with my sisters over the summer, begging my parents to let us stay up to watch just one more episode. So, when I came across this awesome Scooby-Doo dataset containing data on every single Scooby-Doo episode ever made, I knew I had to do at least a little exploration. My immense appreciation goes to the Kaggle user plummye, who tirelessly put together the dataset and graciously shared it with the public. Tidytuesday created a handy data dictionary for this dataset as well. I’d recommend taking a quick look at the dictionary before we get started
If you want to follow along in the project, you can find it here to upload to your instance.
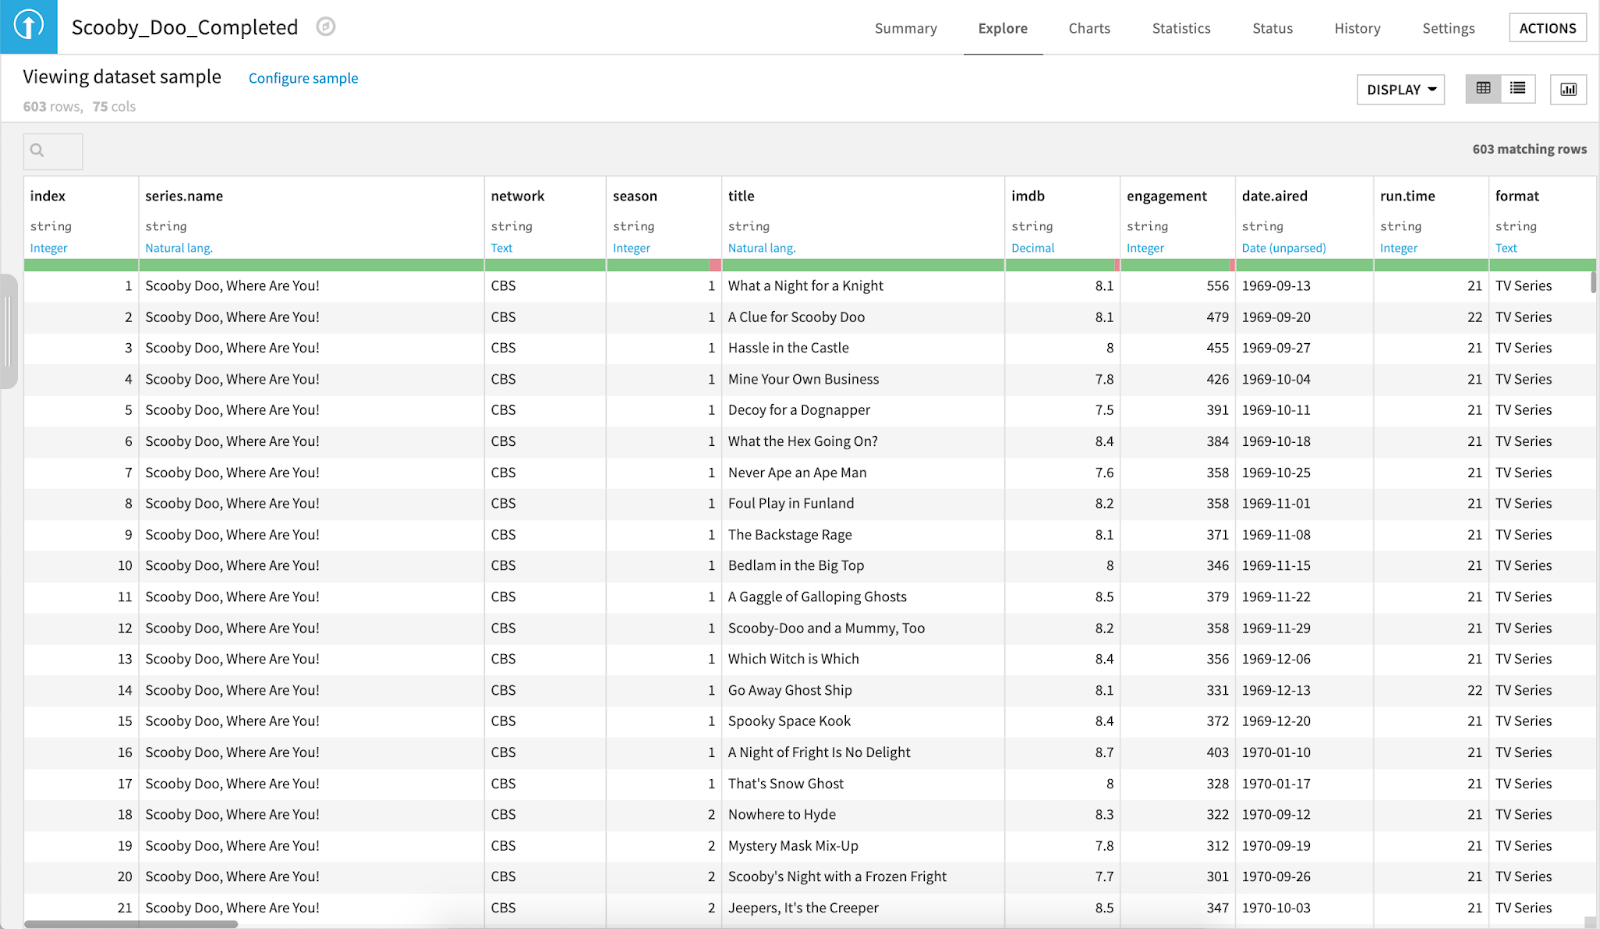
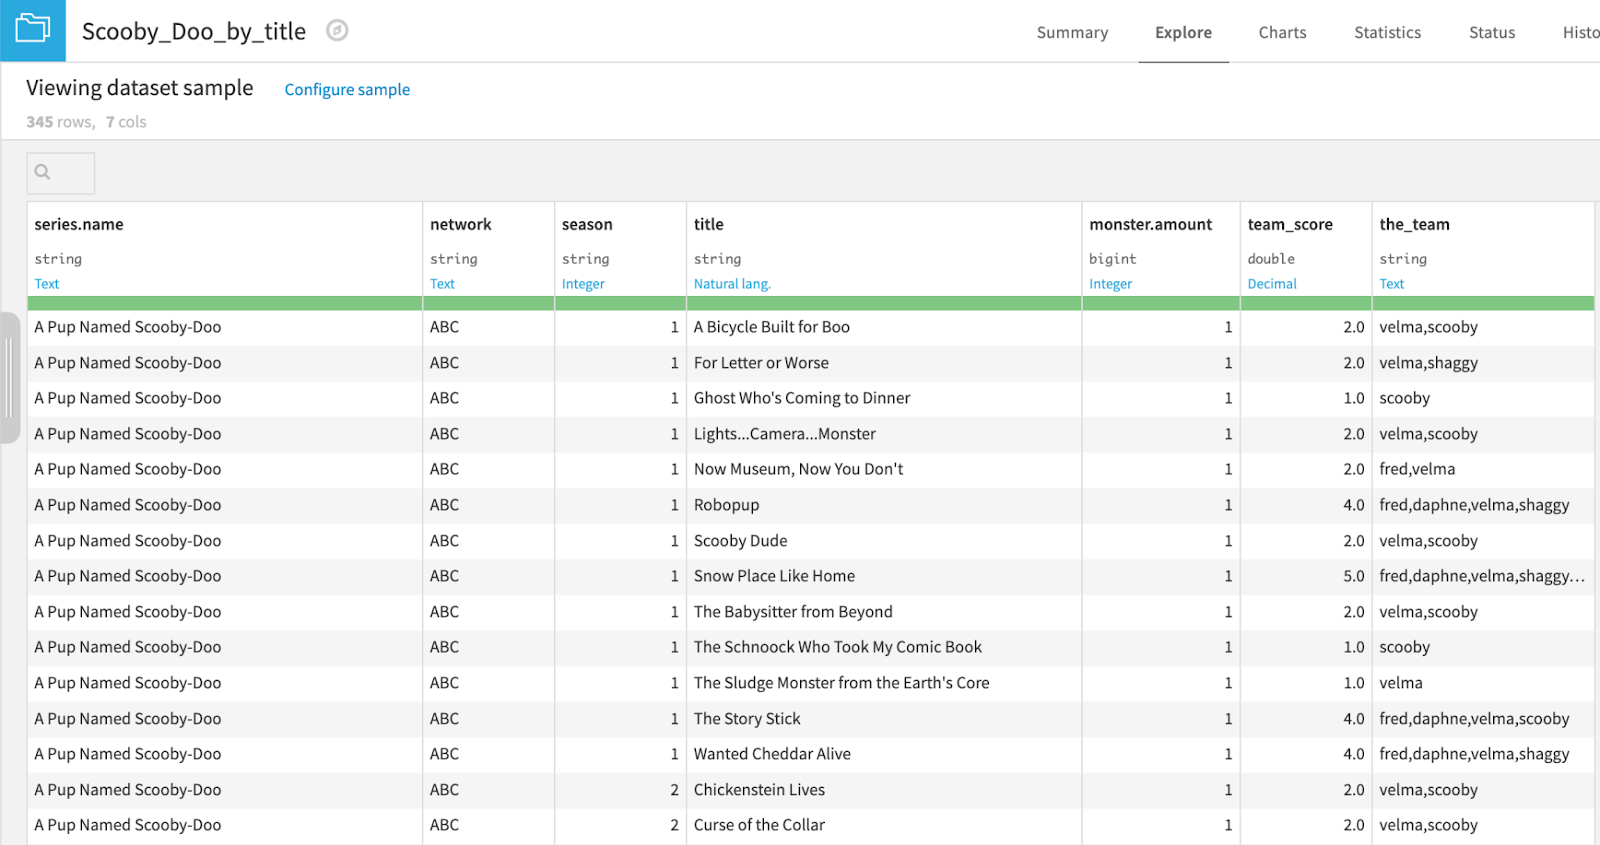
First, let’s upload the Scooby-Doo dataset to a project in Dataiku. The data should look like this:
Understanding the Data
Taking time to understand what each column of our data contains will not only help us decide the necessary data cleaning steps, but it will also help us define interesting questions we want to answer with our data. Below are a few ways and helpful tips to understand your data quickly in Dataiku.
Total Columns and Rows
Dataiku displays only a sample of your dataset in the dataset’s Explore page. By default, it shows the first 10,000 records. The Scooby-Doo dataset is 603 rows and 75 columns, so it is small enough that the entire dataset is displayed here. We can look to the top left corner of the Explore page to find the total number of rows and columns.
If the dataset were larger than 10,000 rows, we would look for the record count in the Status tab of our dataset. The Status tab allows you to create Metrics and Checks. These are frequently used in Scenarios to perform data quality checks automatically during scheduled runs of your project flow. However, Metrics can also be extremely useful for generating your own summary statistics on a column. By default, every dataset has a few Metrics already created.
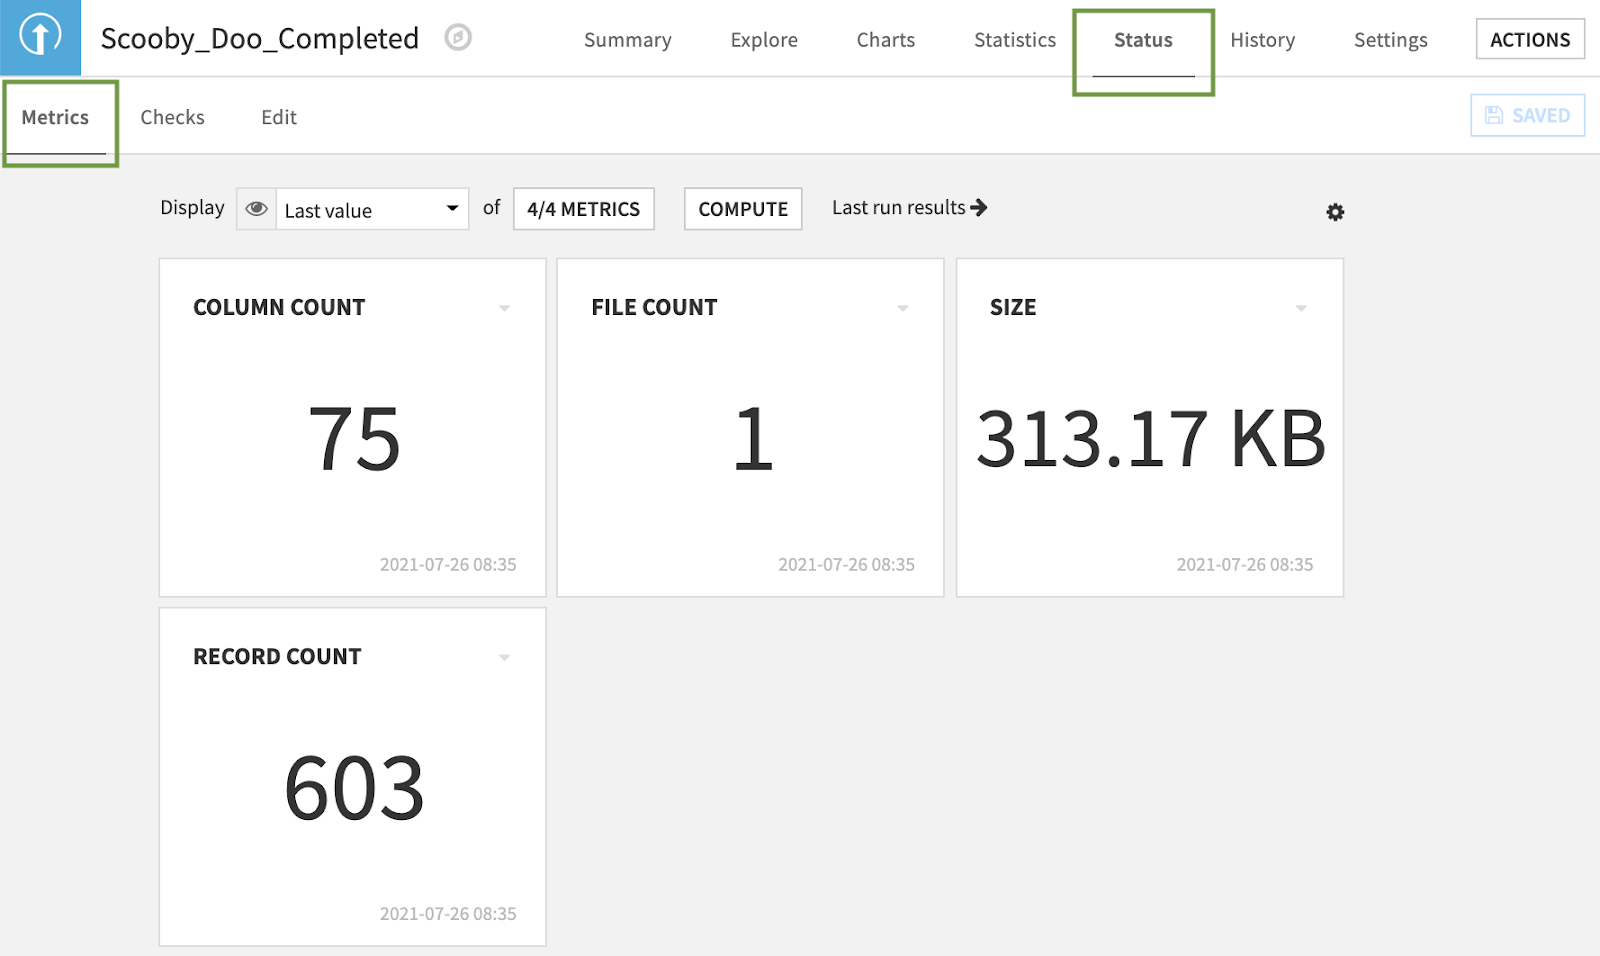
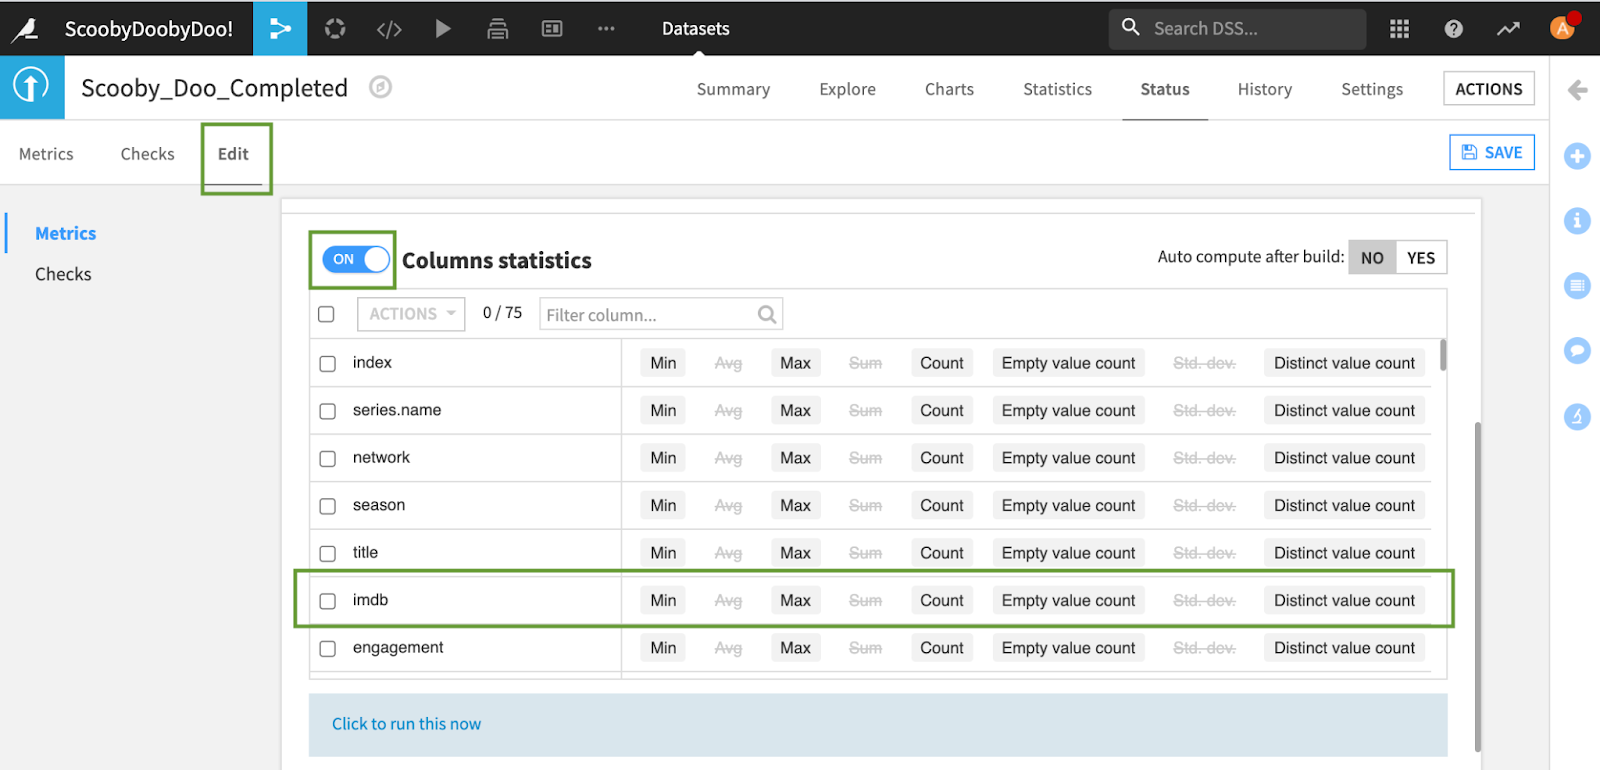
The Edit tab allows you to calculate additional Metrics by toggling certain sections on and off and clicking the column values you’re curious about or writing your own custom probe. You might notice that we cannot take an average or a sum of the IMDb column, a column representing the numerical IMDb score given to the Scooby-Doo episode. Perhaps the column is not a numerical type — let’s take a closer look together.
Column Types and Dataset Schema
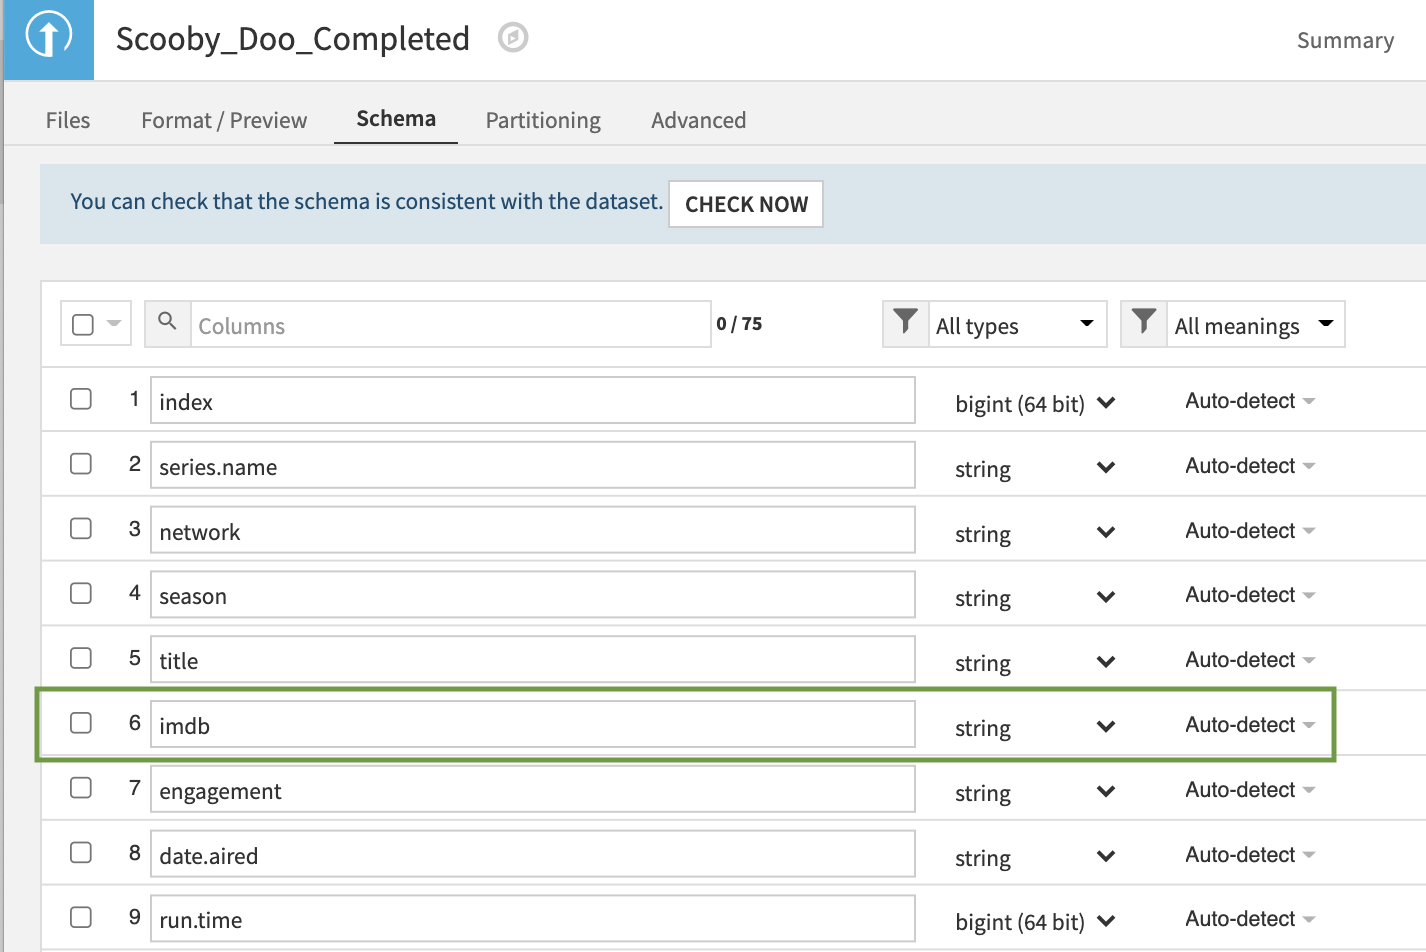
If we go back to the Explore page, we see that all columns in the dataset, including the IMDb score, are stored as Strings.
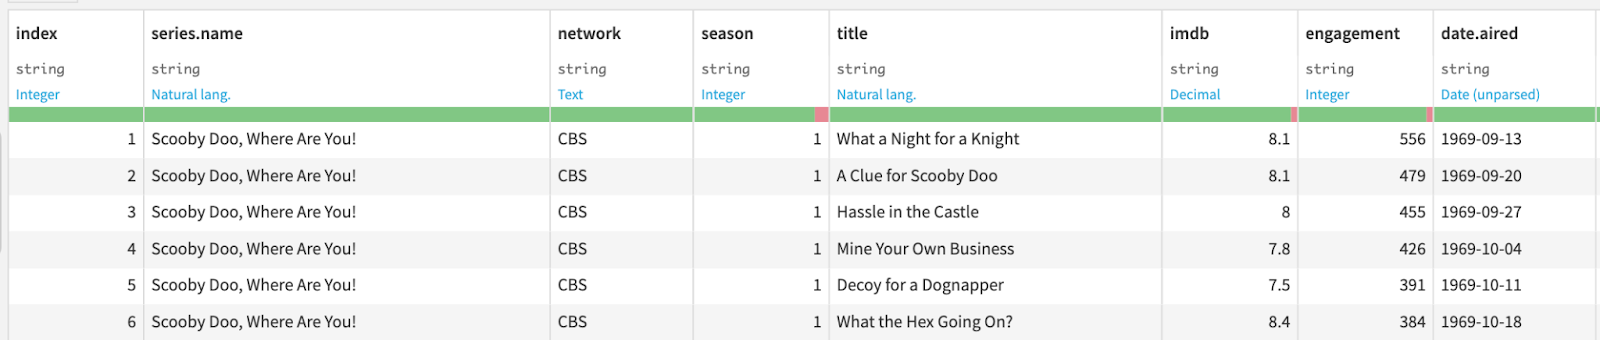
Tip on dataset schemas: The black text indicates how the column’s data is stored in the backend (String). The light blue text is the meaning, inferred from a sample of the data, and is automatically detected by what the column contains (Integer, Natural lang., Decimal, etc.). This helps us find column anomalies, which are highlighted by the green/red bar (The red bar represents the percentage of the column that does not belong to the inferred meaning).
A dataset created by uploading a CSV into Dataiku will have all string column types by default. You can infer the column types from the data by going to Settings > Schema > “Check Now” to ensure the current schema is consistent with the dataset > Infer Types from Dataset.
Still, the IMDb column is a String type. There might be some non-numerical values in the column that are preventing it from being a numerical type. Let’s analyze the column to identify the non-numerical rows.
Column Analysis
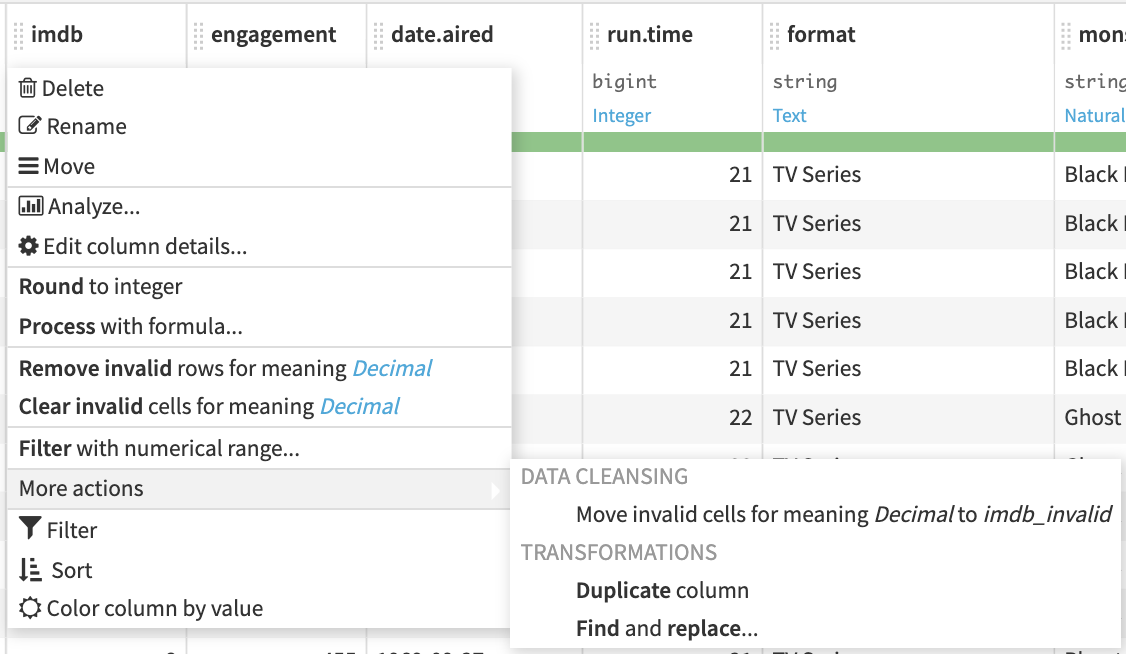
We analyze columns in Dataiku using the Analyze feature, which you can get to by clicking on any one column name.
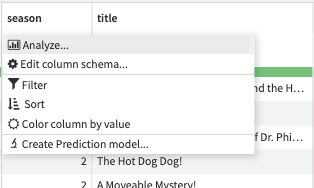
If your dataset is larger than the sample, you may want to run Analyze on the whole dataset.
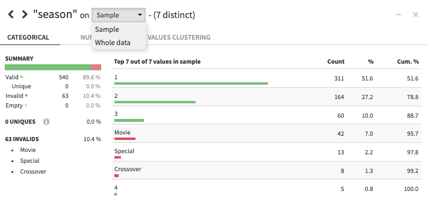
For categorical columns, like season, we can see the total count of records for every category. As cool as it is that we have Movies, Specials, and Crossover events in our dataset, we will want to filter these rows out in order to standardize our analysis on the traditional 20-ish minute episode.
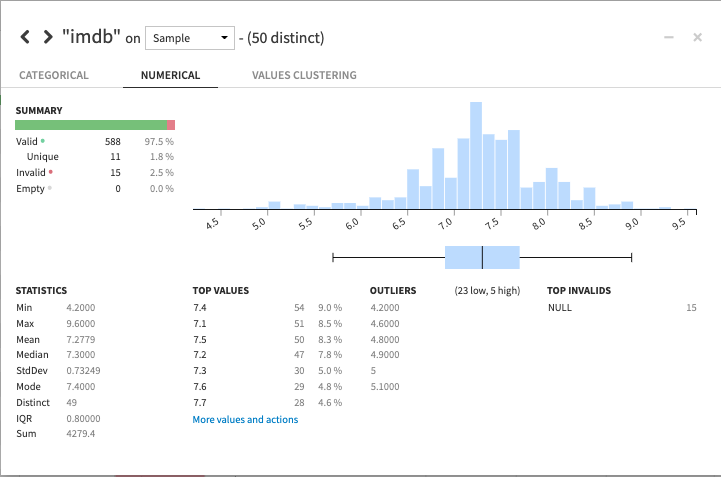
For numerical columns, like IMDb, we can look at the distribution of numbers and find a summary statistics table. In this table, we see that our Top Invalids are rows containing the value “NULL” — these were the non-numerical rows causing our column to be stored as a String. We might also want to filter out these “NULL” rows later.
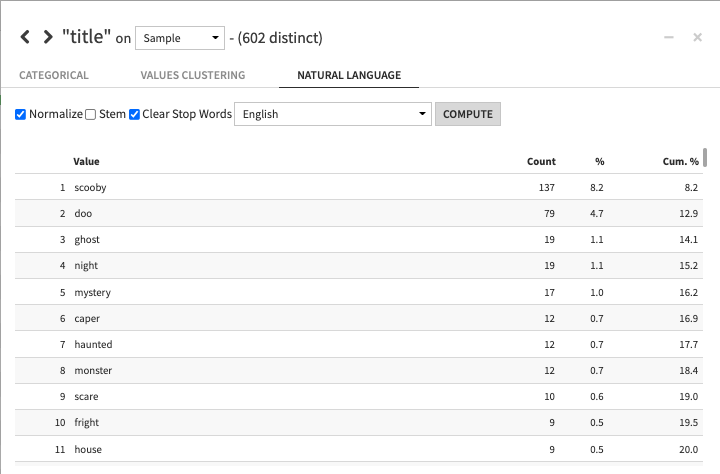
For text columns, we can even do quick natural language processing, clearing stop words and normalizing text to find the words that appear the most. We can clearly see that Scooby is the star of his show (obviously) and we couldn’t blame him if he were scared of ghosts or haunted houses at night.
Cleaning the Data
This dataset’s 75 columns are all super interesting (How cool is it that we know so much about the Monsters in every episode, even down to their sub-type and species?) and my mind is racing with so many questions I want to answer. For the purpose of this blog, though, I will focus on only two of them: Which esteemed member of the Mystery Gang is the best detective? And is the best detective also the best collaborative, team player?
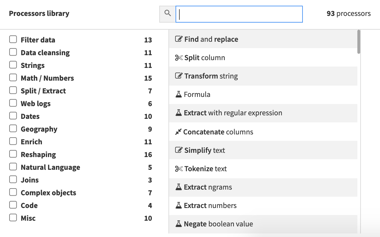
We’ll summarize all the cleaning steps below, but the full project export will provide all of the details. To perform the necessary data cleaning, we will use a Dataiku Prepare recipe, which has over 90 processors that allow you to do things like filter and reshape your data, pre-process text, and write Excel-like formulas.
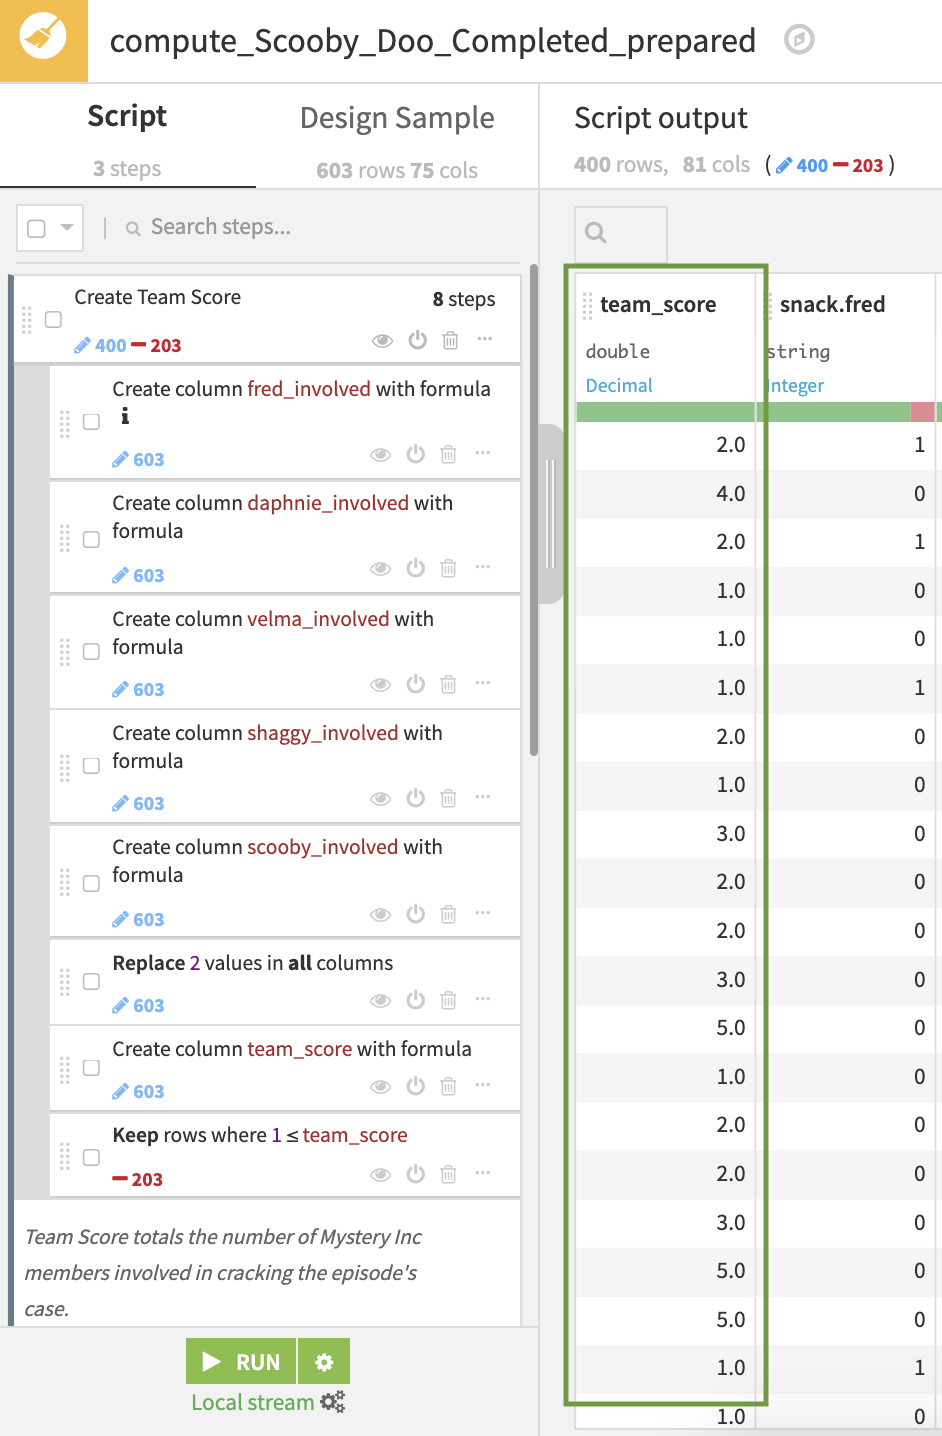
We use the Prepare Recipe to do three main things:
First, we create a “team score” column, indicating the number of Mystery Gang members who were directly involved in solving the mystery in the episode. A team_score of four indicates that four different members of the Gang unmasked, captured, and/or caught a Monster in the episode. Here, we have to be careful not to double-count characters (more in the Tip below).
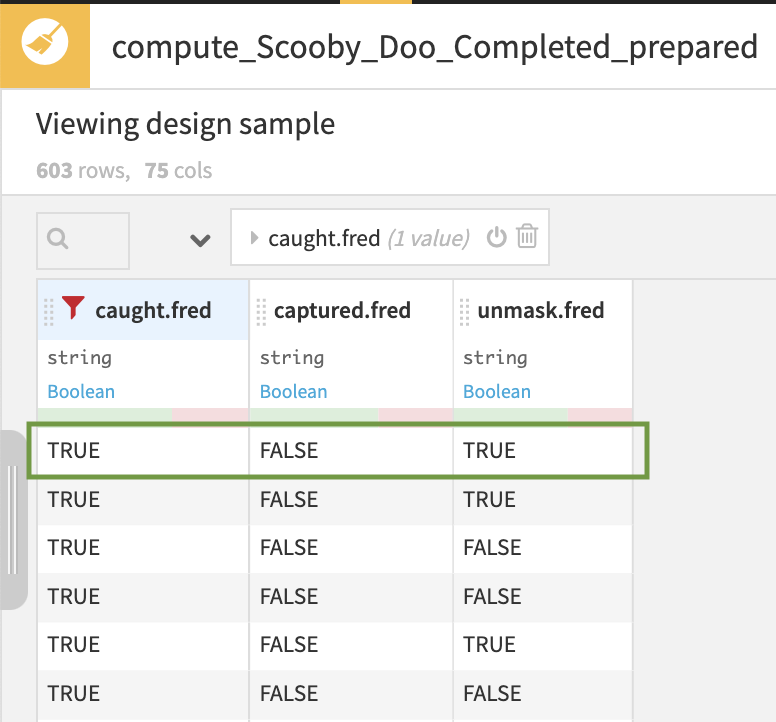
Tip: How did we know there was a risk of double-counting characters? Let’s view only a subset of our data by going to Display > Select Displayed Columns. This is particularly useful when you have too many columns to view on one page. If we show the caught, captured, and unmasked columns for just one character and add a filter on one of the columns (caught.fred = “TRUE”), we’ll see that one character could perform one or more of the actions on a Monster in a single episode. Therefore, performing a row-wise sum of these column values for every character could double (or triple) count them in our total.
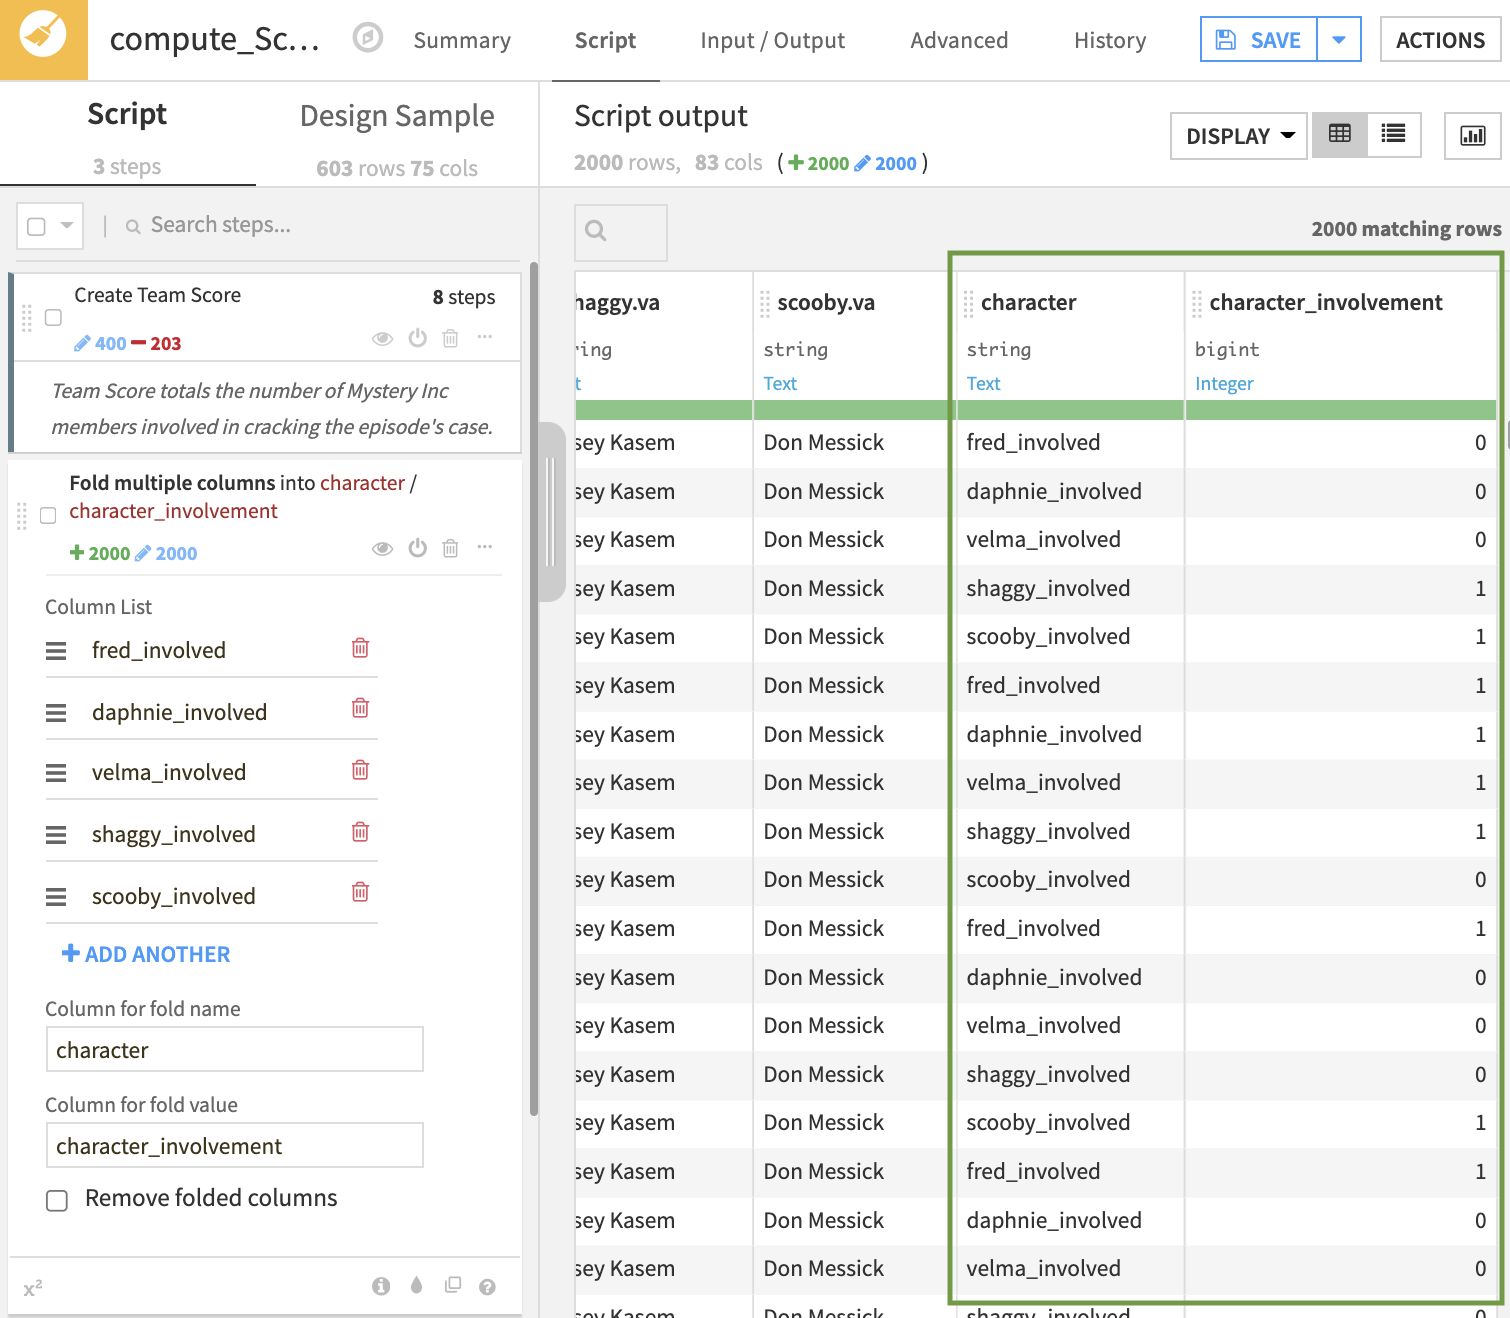
Second, we need to reshape our dataset from wider to longer, folding the columns that we created in the first step. This involves taking the value of these columns and placing them all in one column, which results in having five records for every episode, one for every member of the Mystery Gang. Our data is now more granular, where every row represents an episode-character pair. This allows us to build charts that slice our data by character to compare them with each other (we’ll do this later).
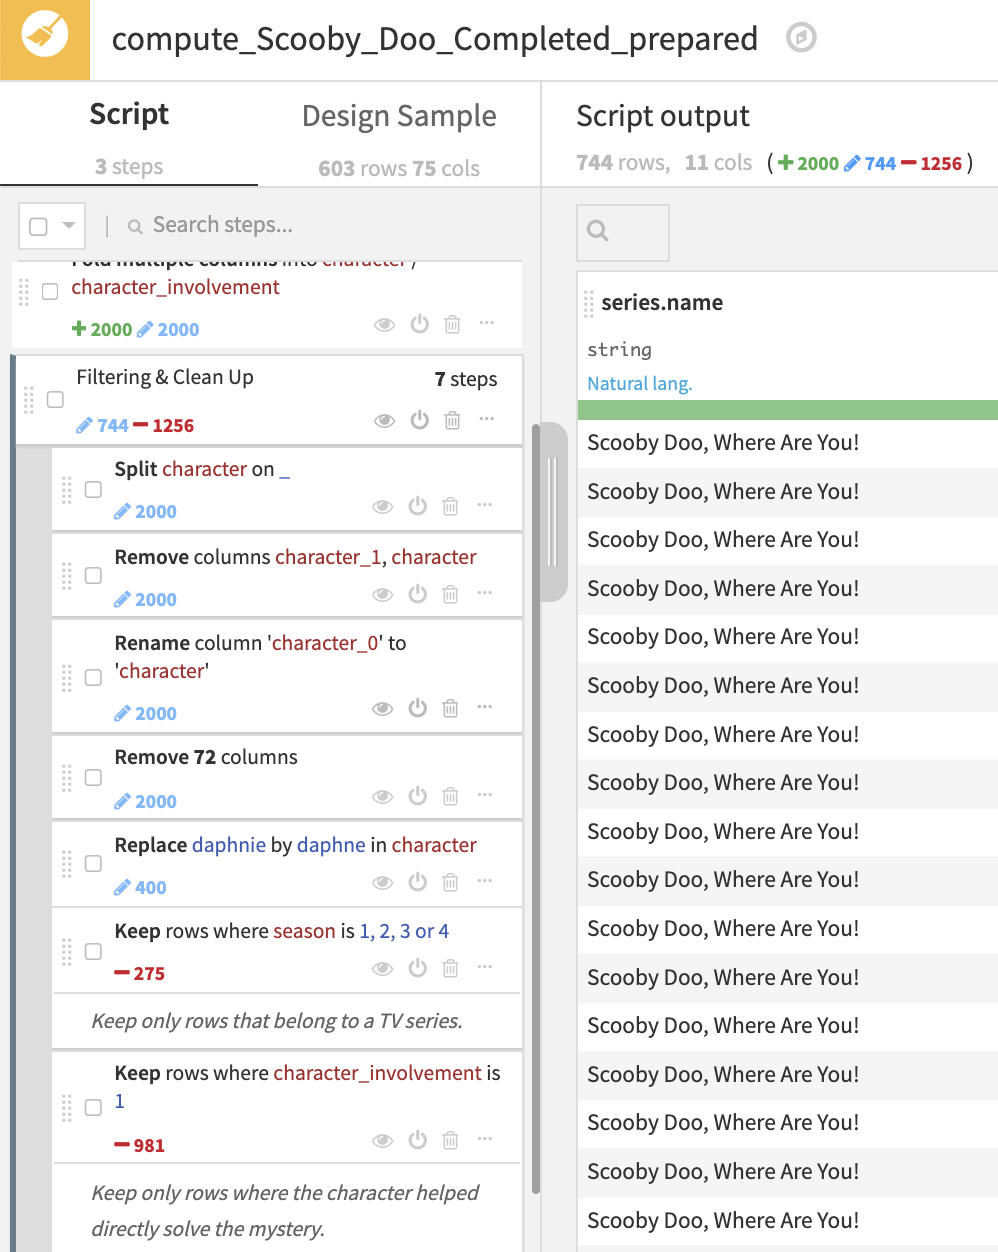
Finally, we perform clean up steps to remove unnecessary columns, rename columns, and filter out records. Here, we filter our records that do not belong to a normal TV series episode and remove rows where the character was not involved in solving the mystery.
Tip: Click on the column name in a Prepare Recipe to perform cleaning operations directly on the column. This will automatically create a step in the recipe for you and can be much faster than creating a processor step manually.
Visualizing the Data
This is the moment we’ve all been waiting for. Now that our data has been cleaned, we can create visualizations to answer our questions about the dataset. Let’s figure out who the best detective is!
We can create charts on the Prepare recipe output dataset by going to the Charts tab, clicking and dragging columns over to the X and Y axis inputs, and changing the chart type on the top left.
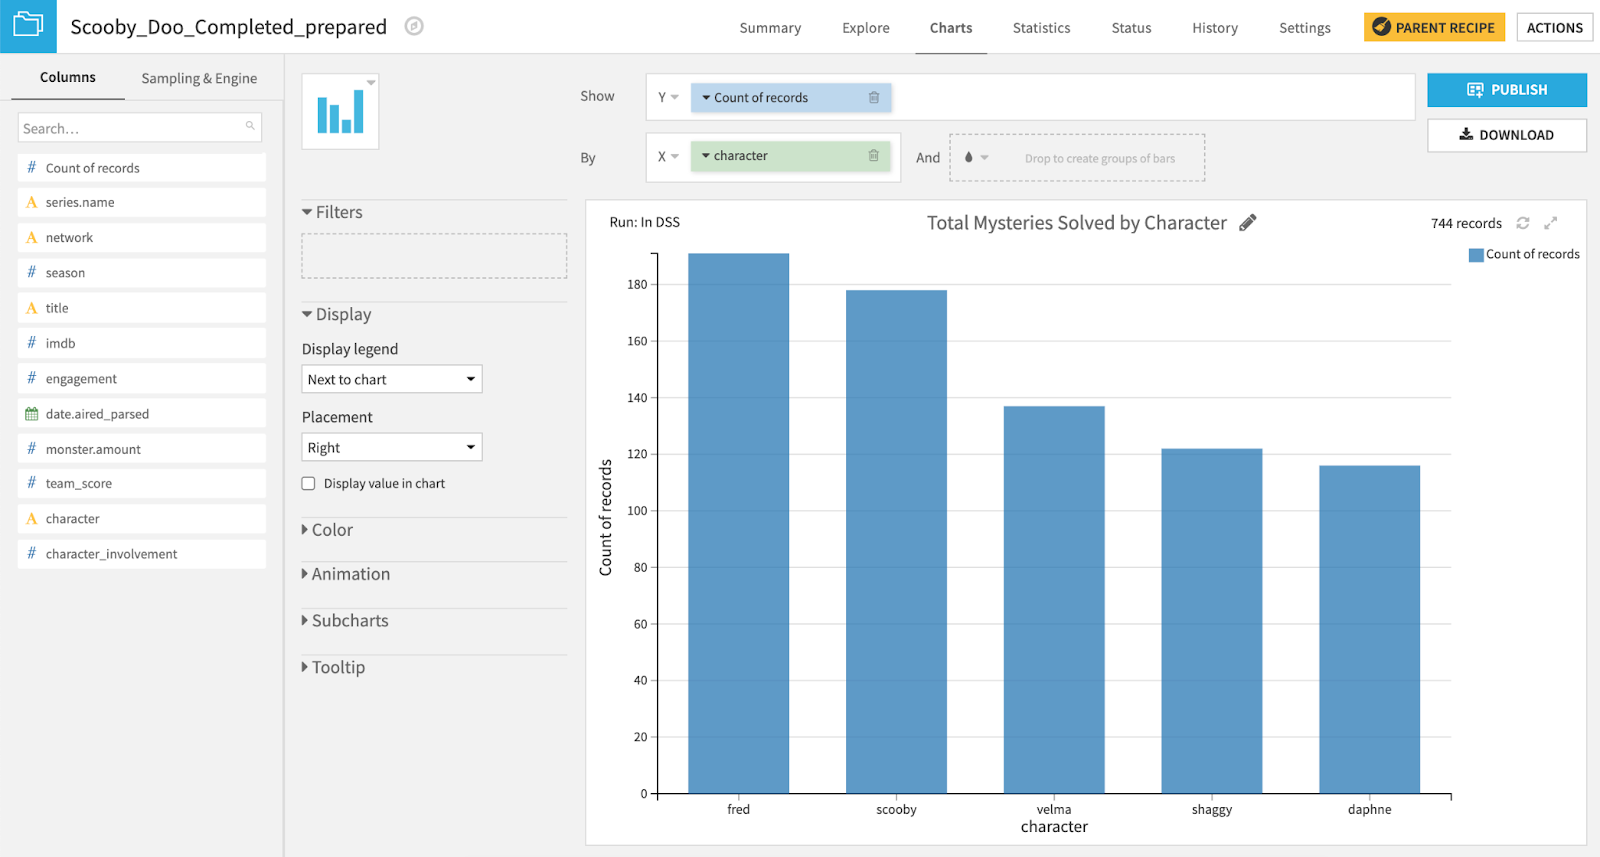
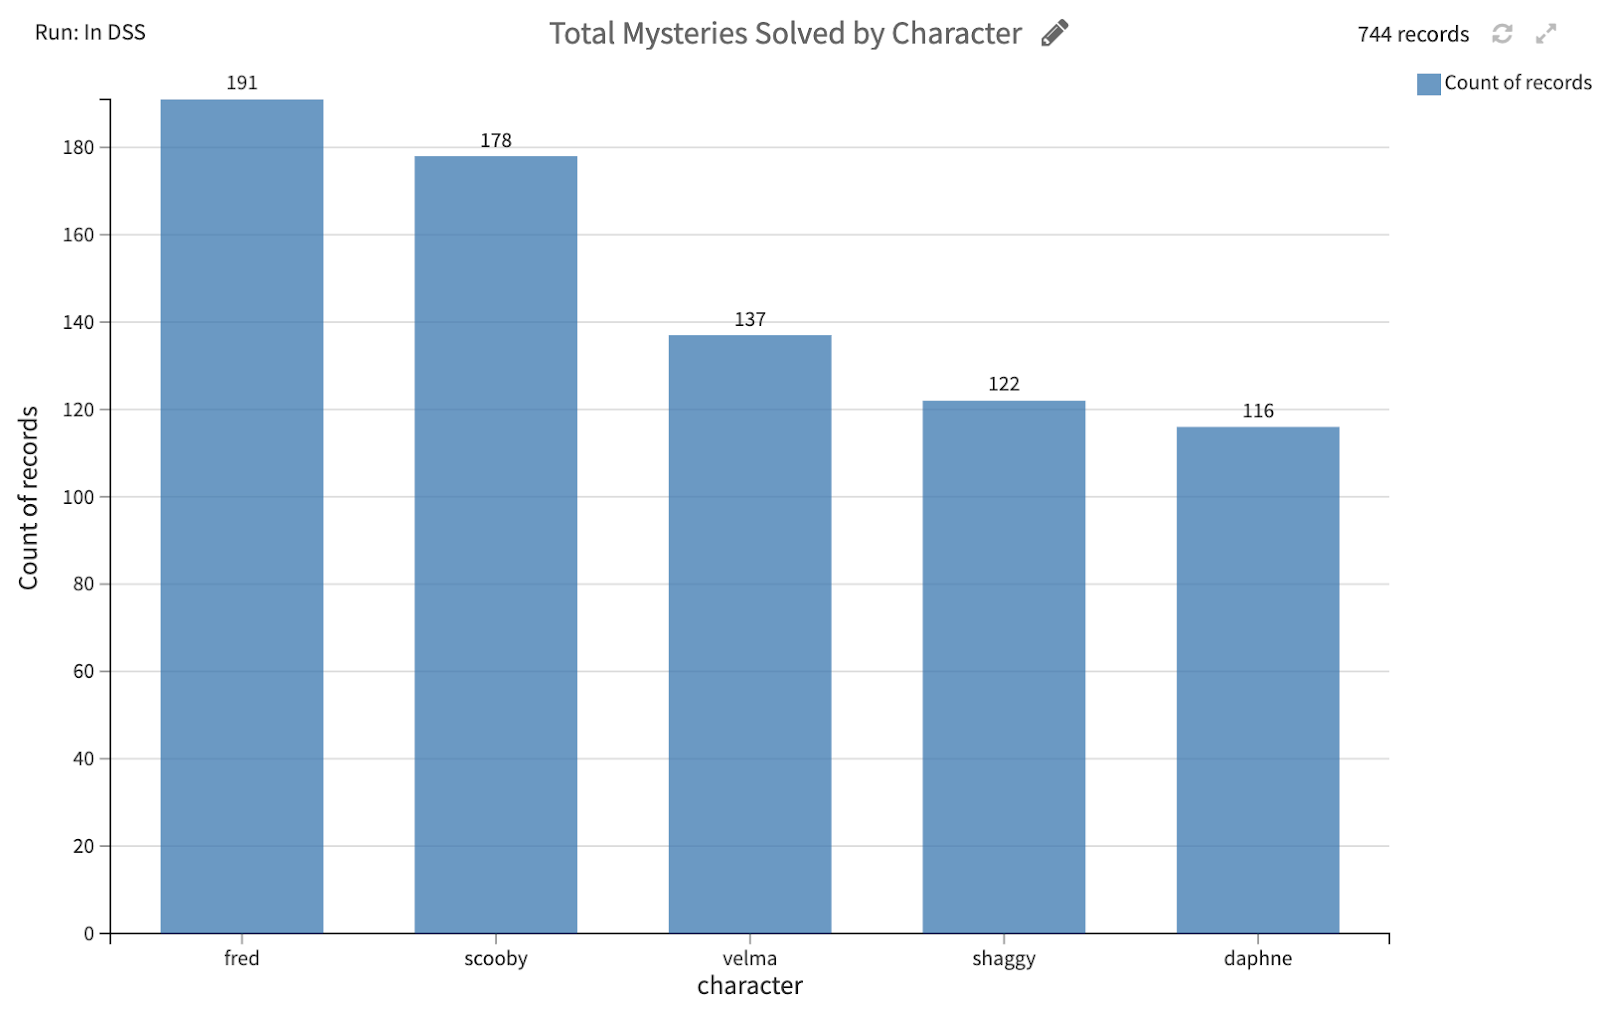
Totaling the records for every character tells us how many mysteries (aka the number of episodes) each character has directly helped solve by unmasking, capturing, or catching the Monster. Fred beats out Scooby by helping solve 191 mysteries compared to Scooby’s 178. But how many of these mysteries were solved alone versus with others?
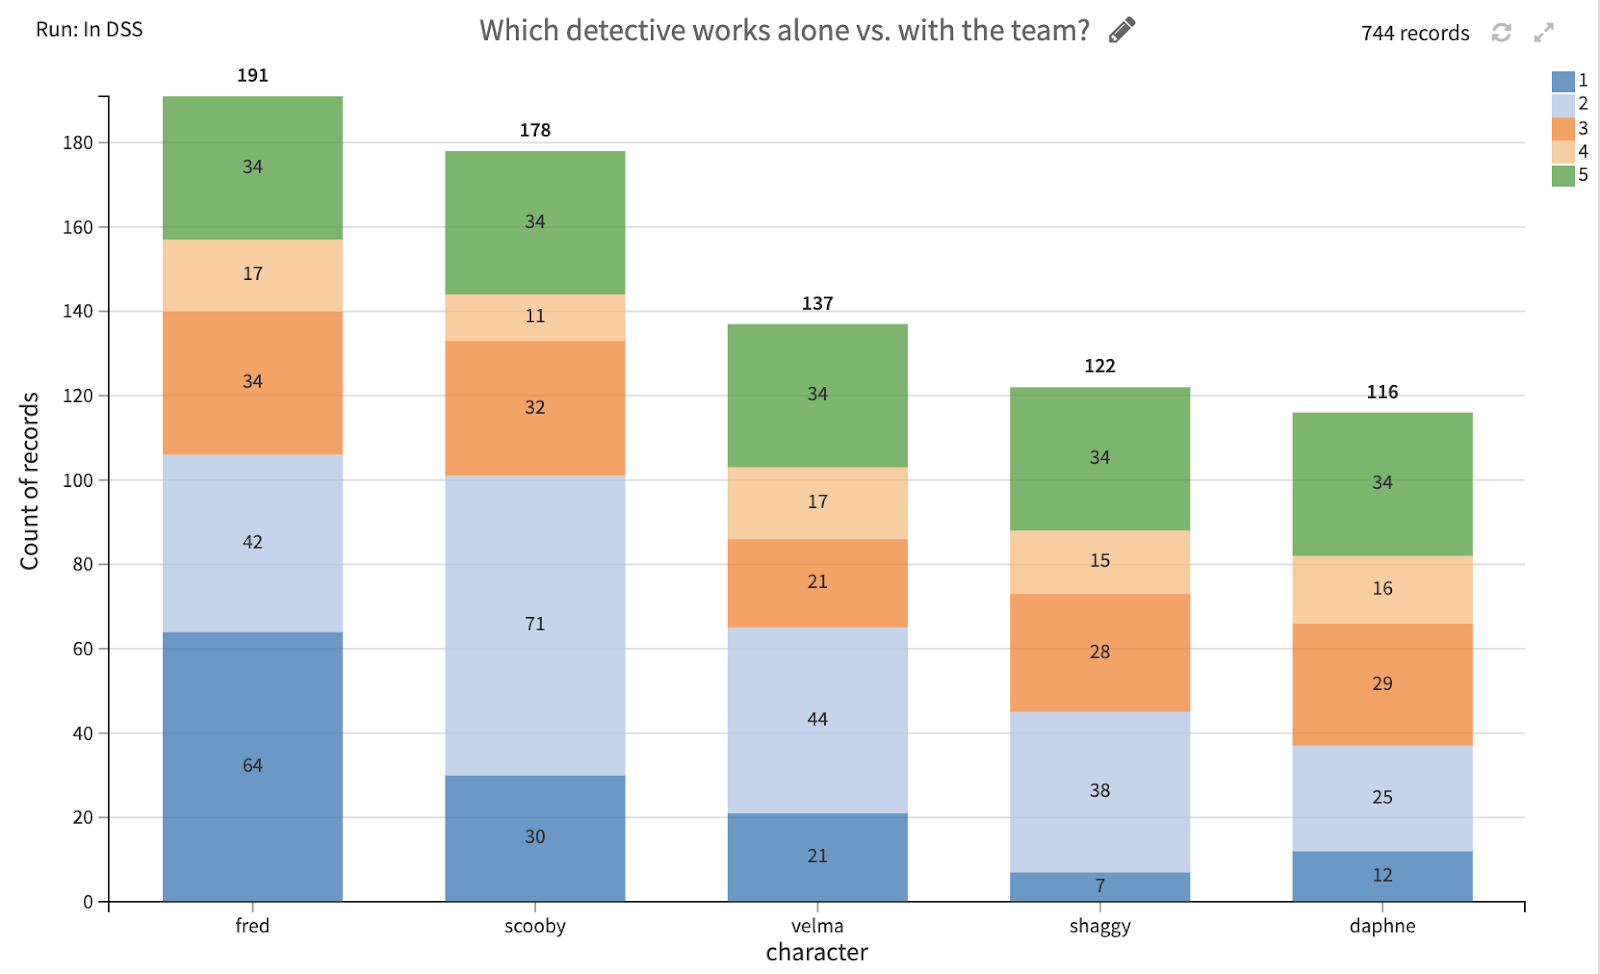
Let’s color the chart by team_score (team of 5 - green, team of 4 - light orange, team of 3 - orange, team of 2 - light blue, team of 1 - dark blue). We can see that 64 of the 191 mysteries Fred solved (33%), were solved alone, while Shaggy solved only 7 out of 122 mysteries alone (5%), and solved most of his mysteries with a partner (Scooby!).
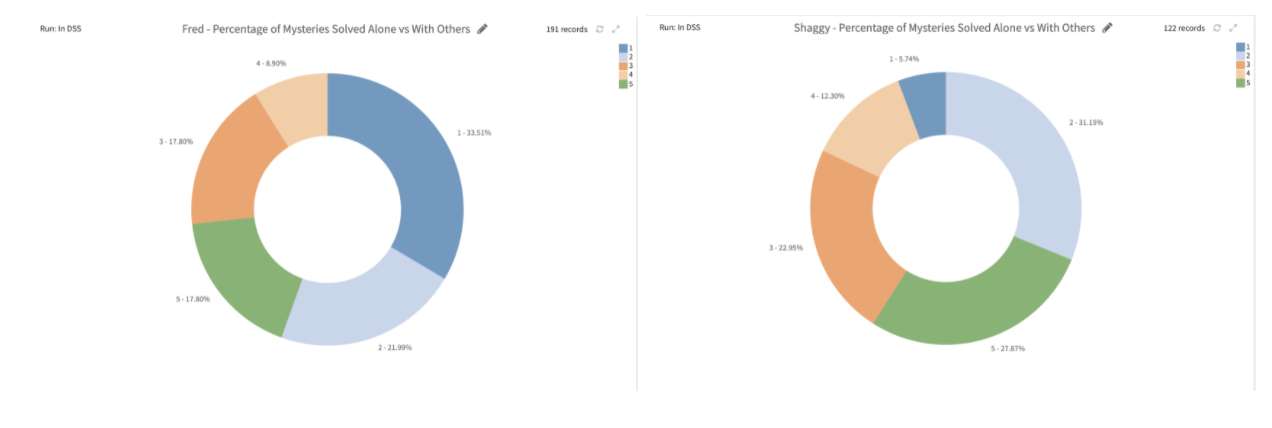
The side-by-side pie charts showing Fred and Shaggy’s solved mysteries reveal just how large the percentage of solo-solving mysteries Fred has compared to Shaggy’s (dark blue).
Jeepers! Fred might be considered the “best” detective because he solved the most mysteries, but it seems like he may not be the best at working with a team. Perhaps his signature catch phrase, “Let’s split up, gang…” was really just a way for him to separate the team so he could be the one to uncover the mystery. Let’s dig into who works together the most in these episodes before we make such accusatory conclusions.
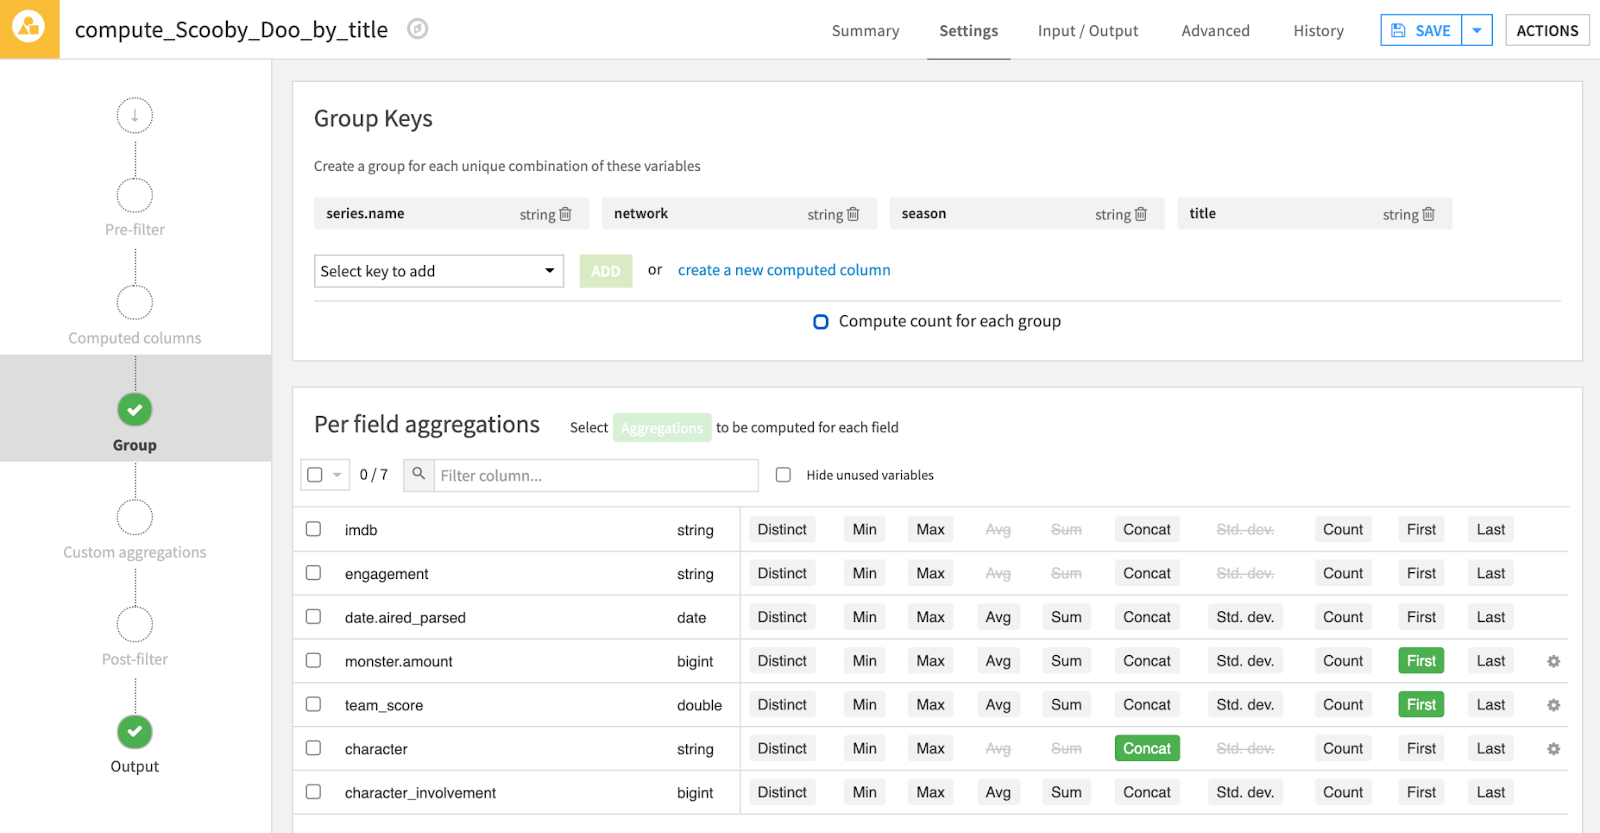
We can use a Group Recipe to concatenate the character list into one field (called the_team) for every episode.
The output dataset contains one row for every episode along with who was involved in cracking the mystery.
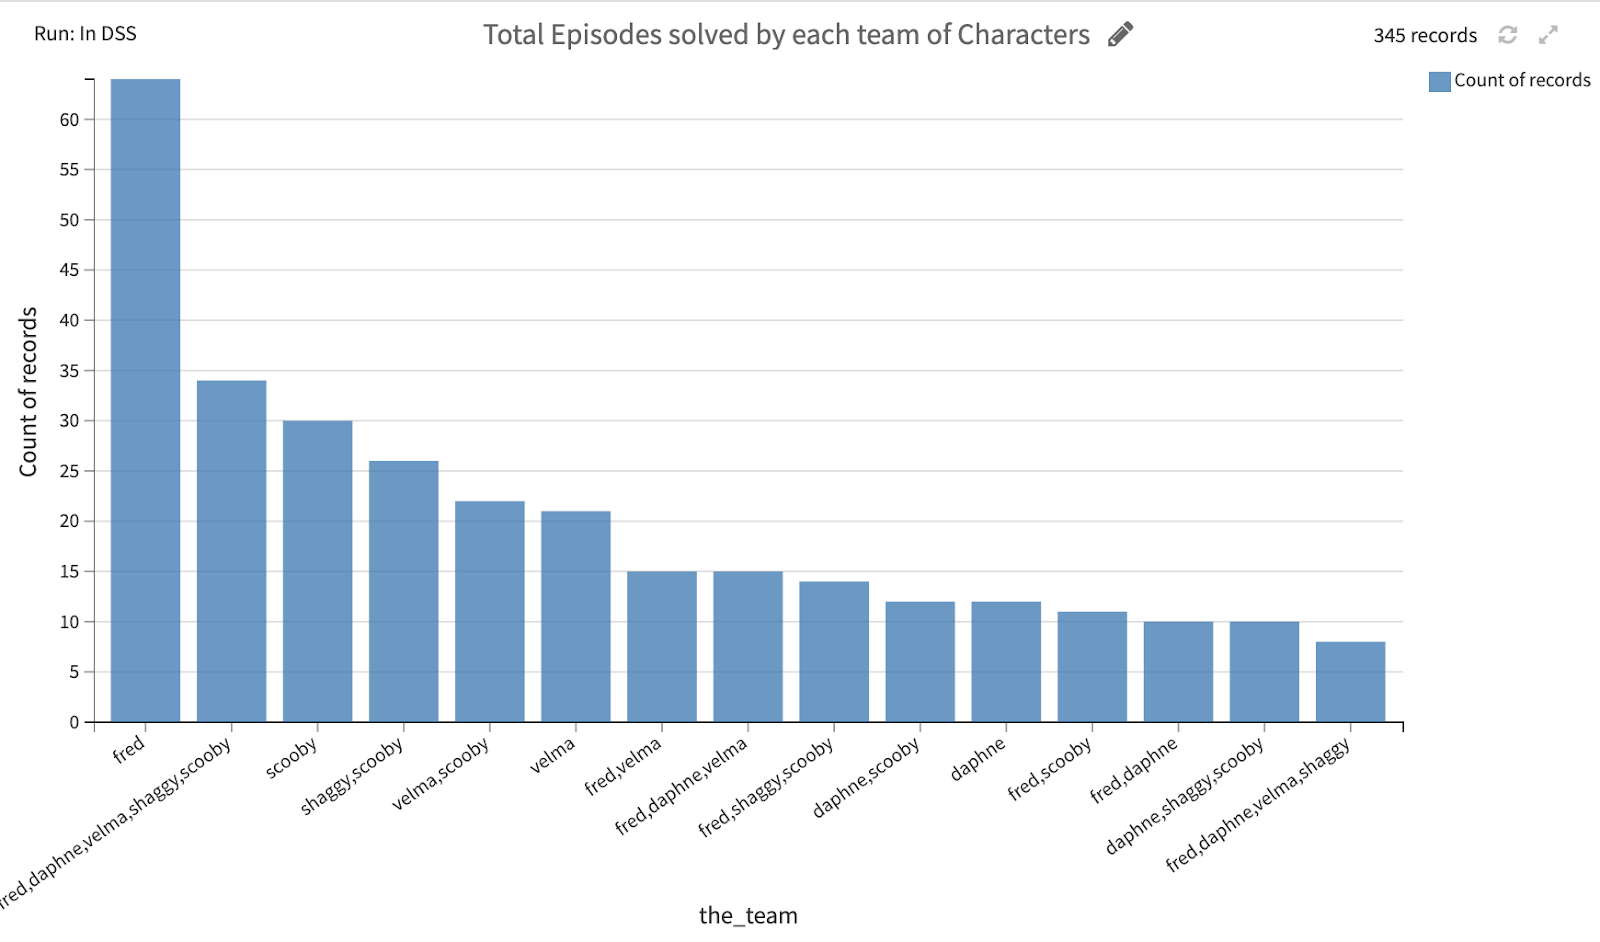
Aggregating the total number of episodes solved by every individual or team is illuminating. Fred solves almost two times as many mysteries alone as the entire gang solves together!
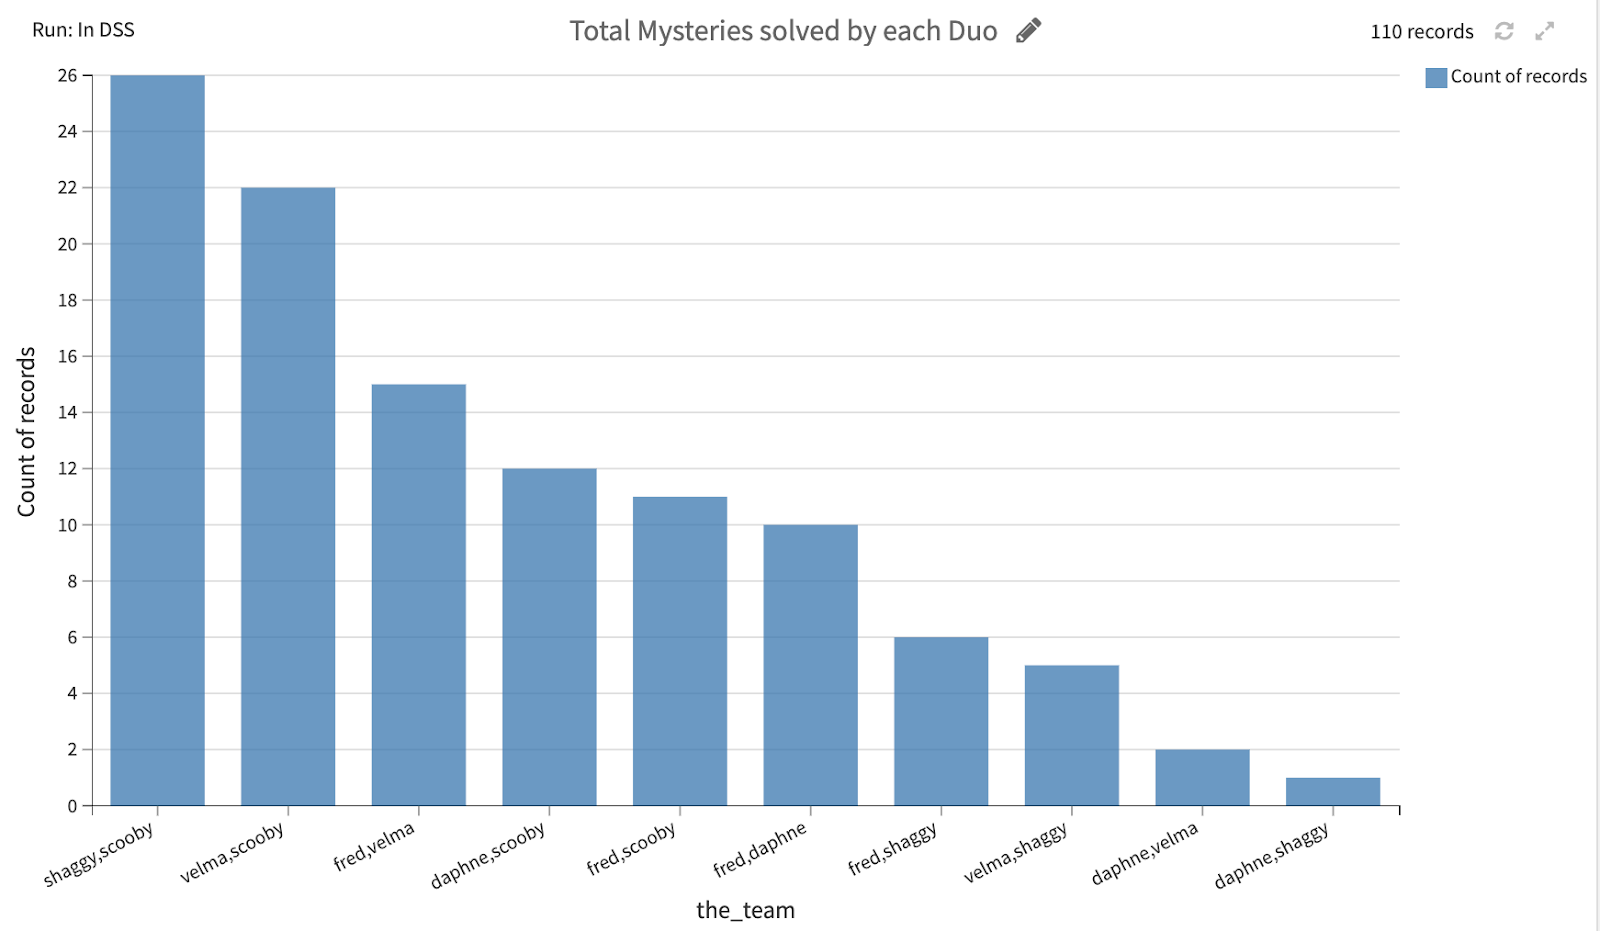
Looking only at teams of two, it’s no surprise that Shaggy and Scooby work together most frequently.
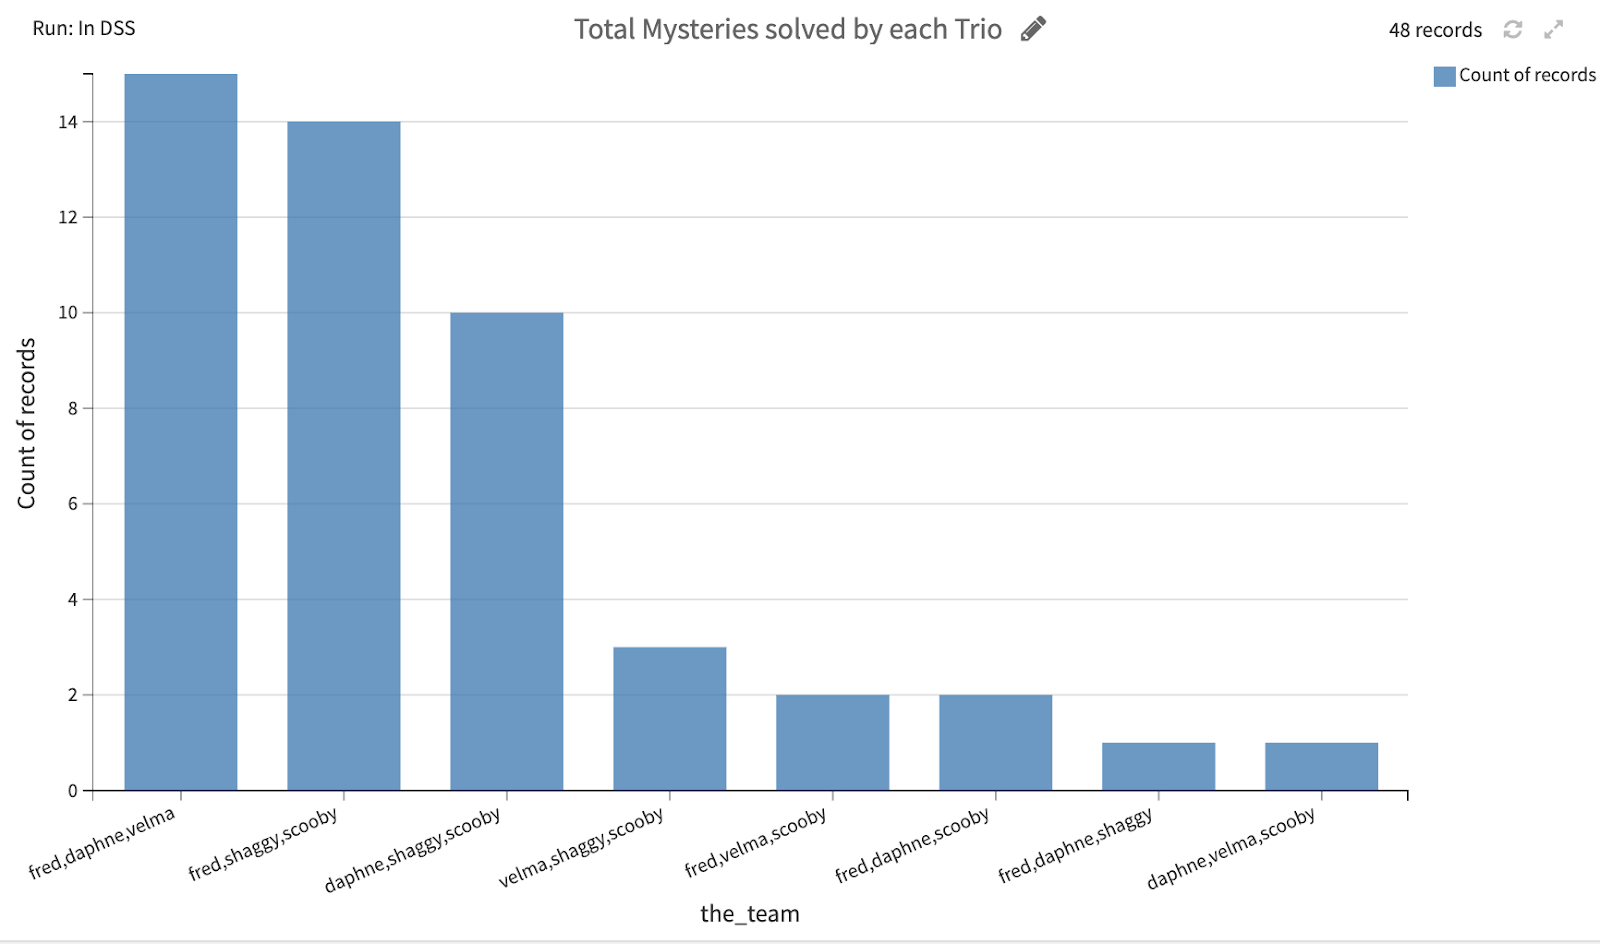
Looking at teams of three, we see Fred, Daphne, and Velma solve the most mysteries together (which makes sense because Shaggy and Scooby are off together getting chased by Monsters)!
So, can we really conclude from this analysis that Fred isn’t a team player and is purposely splitting the Gang up so that he can be the one to uncover the mystery first? Absolutely not. But, we can use this initial analysis to inform future work.
- How do we improve the way we’re defining teamwork in our data (this is currently team_score)?
- Can we perform Natural Language Processing on episode transcripts to understand the team dynamics better?
- Is there any progression over time that shows Fred working more with the team?
- Which Monsters are the most difficult to catch?
These are just a few of the many questions we could try to answer next to enhance our existing analysis. Although EDA may never be completely done, it is an essential part of any data project. I hope that this walk-through helps you embrace the uncertainty and excitement of EDA, and provides some guidance for the Dataiku features that can make doing EDA easier.