Popular Machine Learning Algorithms
This guide will help aspiring data scientists and machine learning engineers gain better knowledge and experience. I will list different types of machine learning algorithms, which can be used with both Python and R.
When starting out with Data Science, there is so much to learn it can become quite overwhelming. If you need more understanding of the foundations of Data Science, check out this article: Best Data Science Books for Beginners
This guide will help aspiring data scientists and machine learning engineers gain better knowledge and experience. I will list different types of machine learning algorithms, which can be used with both Python and R.
1. Linear Regression
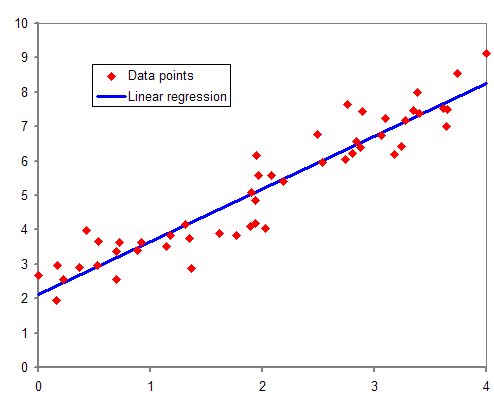
Source: Wikipedia
Linear Regression is the simplest Machine learning algorithm that branches off from Supervised Learning. It is primarily used to solve regression problems and make predictions on continuous dependent variables with the knowledge from independent variables.
The goal of Linear Regression is to find the line of best fit, which can help predict the output for continuous dependent variables. For example, continuous values are house prices, age, and salary.
Simple Linear Regression is a model that estimates the relationship between one single independent variable and one dependent variable using a straight line. Multiple Linear Regression consists of more than two independent variables.
2. Logistic Regression
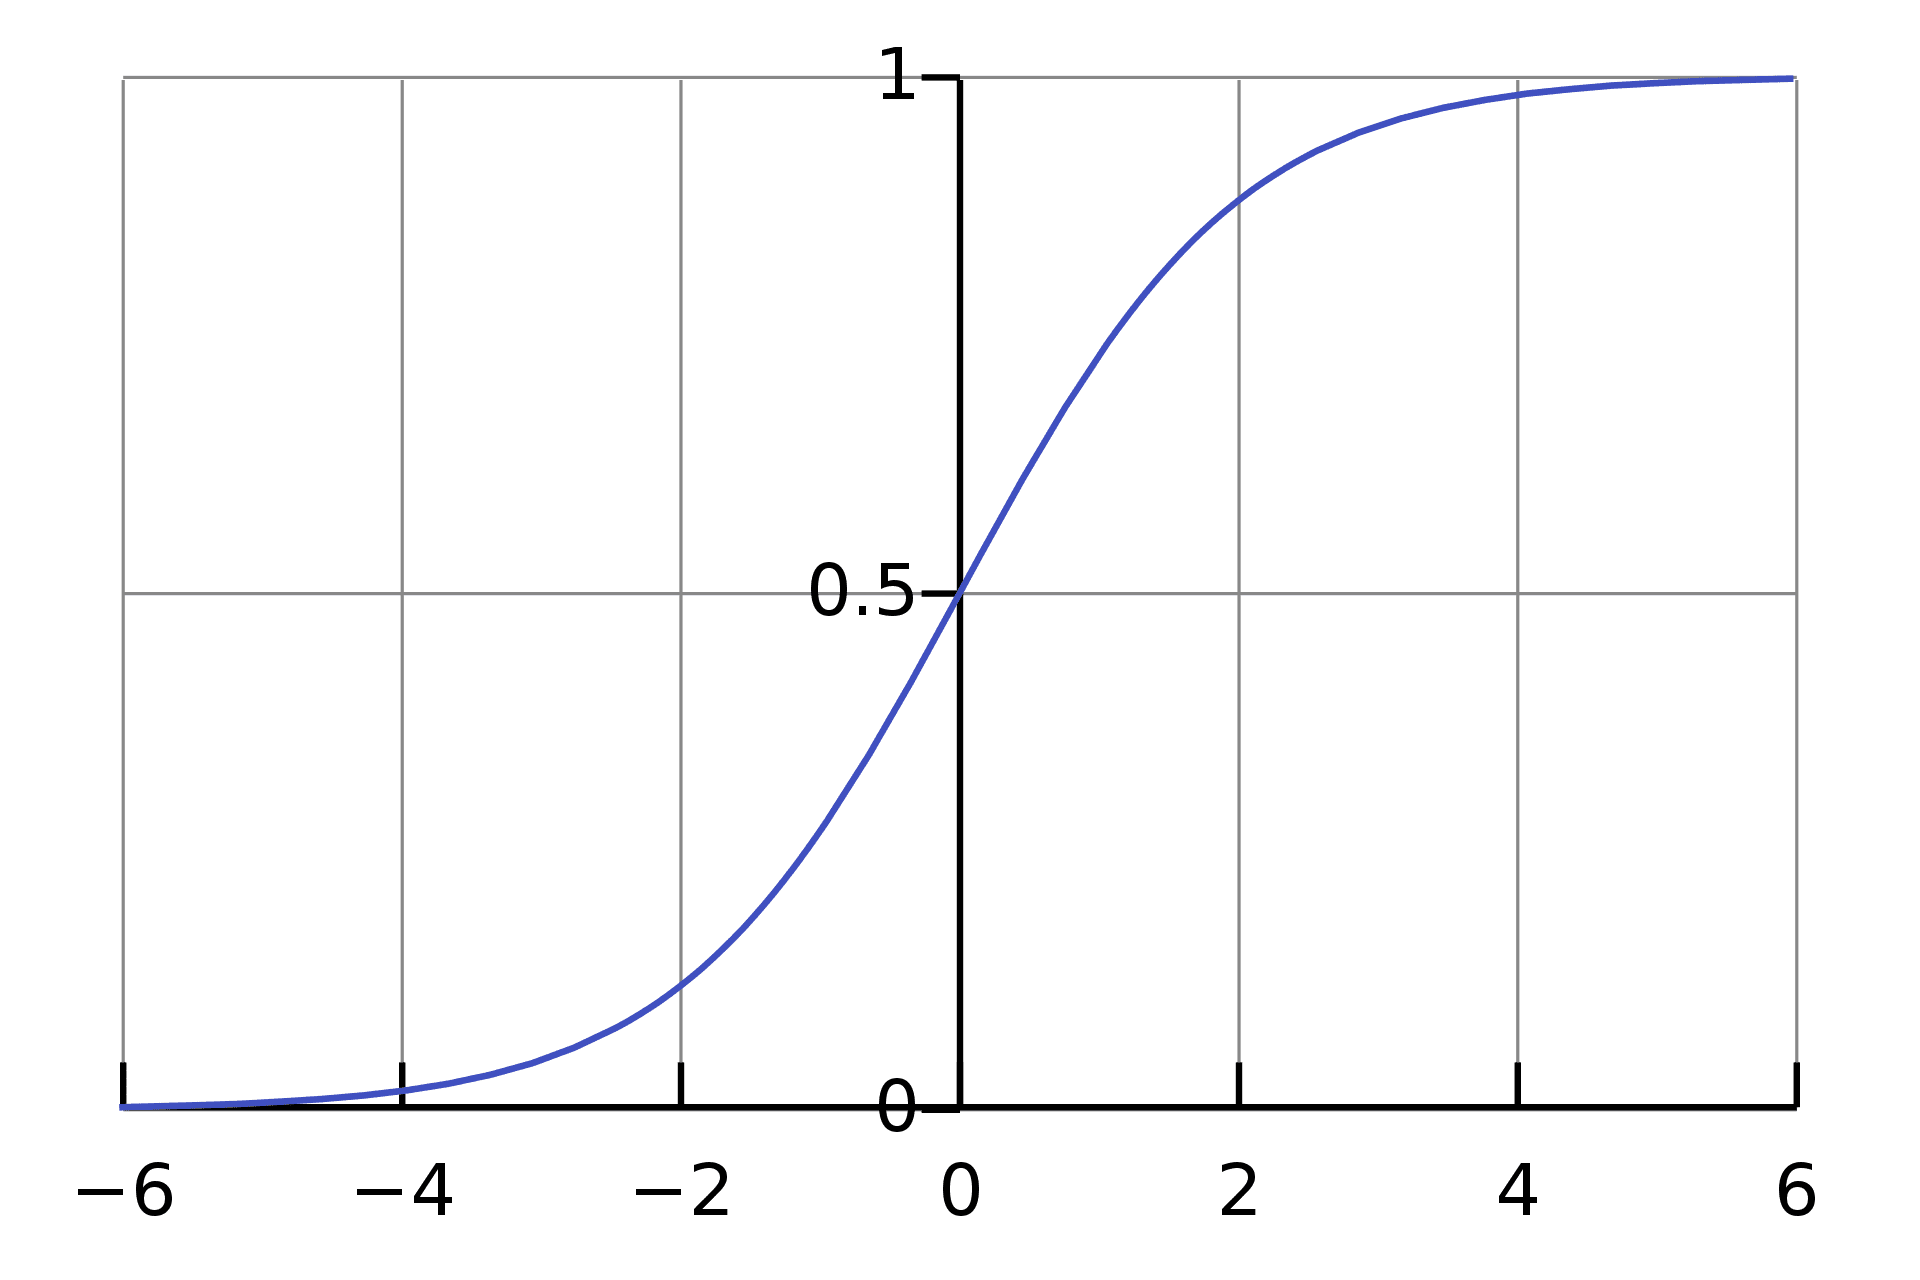
Source: Wikipedia
Logistic Regression is another Machine Learning algorithm that branches off supervised learning. It can be used for both Regression and Classification tasks, however, it is mainly used for Classification. If you would like to know more about Logistic Regression used for Classification tasks, click on the link.
Logistic Regression is used to predict the categorical dependent variable with the knowledge of independent variables. The aim is to classify outputs, which can only be between 0 and 1. The weighted sum of inputs is passed through an activation function called Sigmoid Function which maps values between 0 and 1.
Logistic Regression is based on Maximum Likelihood Estimation, a method to estimate the parameters of an assumed probability distribution, given some observed data.
It is easy to get confused between the Linear and Logistic Regression, so if you would like a deeper explanation of the two, have a read of this article: Linear vs Logistic Regression: A Succinct Explanation.
3. Decision Tree
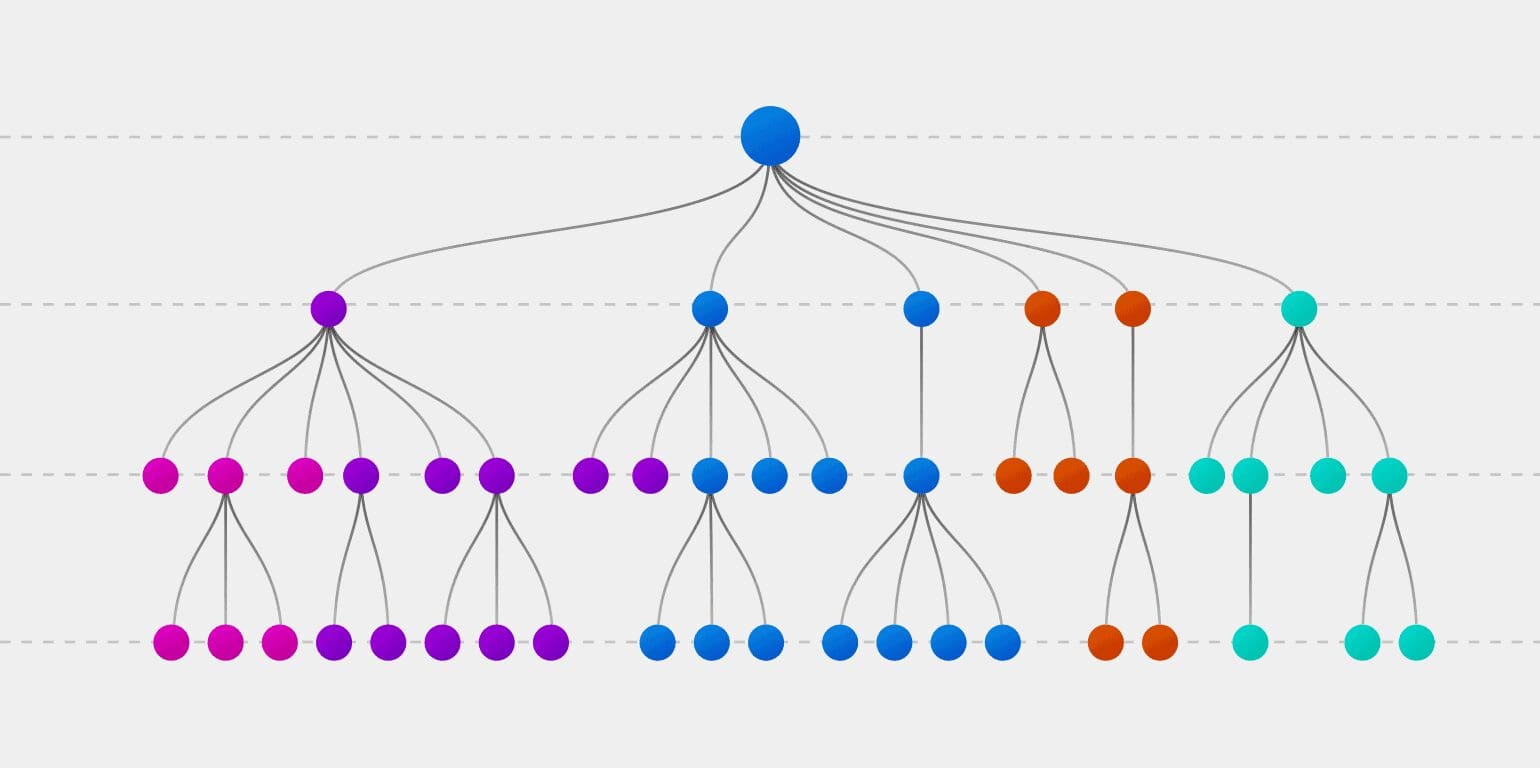
Source: explorium
The Decision Tree is another machine learning algorithm that branches off supervised learning. The decision tree algorithm can be used for both regression and classification problems.
It is a tree-like model which is used in the decision-making process by visually displaying decisions and their potential outcomes, consequences, and costs. The concept resembles the human mind; by splitting the data into parts. As we granulate the data as much as we can, we have split them into unique pieces.
The overall aim of a Decision Tree is to create a training model that can be used to predict the class of the target variable.
There are two types of decision trees based on the type of target variable:
- Categorical Variable: A Decision tree where the target variable is Categorical.
- Continuous Variable: A Decision tree where the target variable is Continuous.
4. Random Forest®
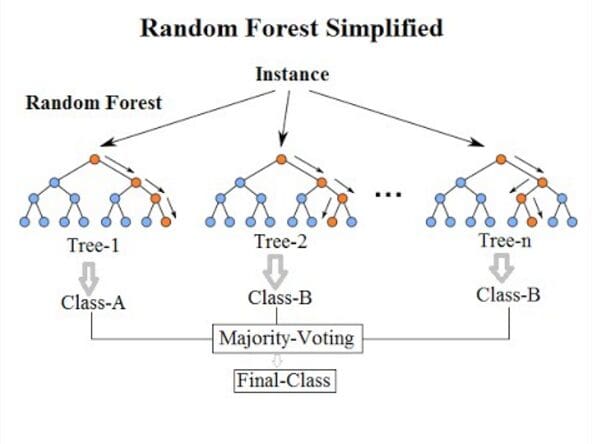
Source: Wikipedia
The next machine learning algorithm is the random forest algorithm which is a supervised machine learning algorithm widely in classification and regression problems. Just like a decision tree, it is also a tree-based algorithm. However, the random forest algorithm uses multiple decision trees for making decisions - a forest of trees.
The random forest algorithm handles regression tasks using datasets that contain continuous variables, whilst it used categorical variables to handle classification tasks.
The random forest algorithm is an ensemble, which means combining multiple models, where a collection of models are used to make predictions rather than using an individual model.
Ensemble uses two types of methods:
- Bagging: This generates additional data for the training dataset. This is done to decrease the variance in the predictions.
- Boosting: This combines weak learners and transforms them into strong learners by creating sequential models so that the final model has the highest accuracy.
5. Naive Bayes
Source: Medium
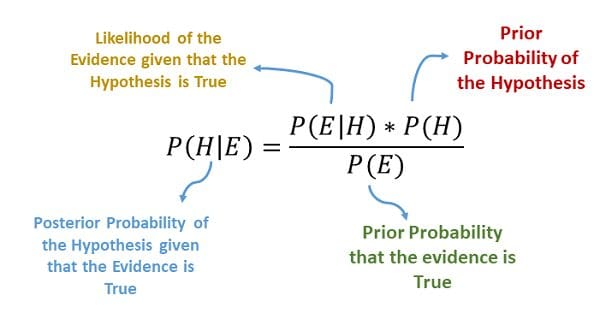
Naive Bayes is a classification technique based on Bayes’ Theorem. Bayes’ Theorem is a mathematical formula used for calculating conditional probabilities.
The formula above is:
- How likely does H happens given that E happens (Posterior Probability)
- How likely does E happen given that H happens
- How likely does H happen on its own
- How likely does E happen on its own
It assumes that when a particular feature is present in a class, it is unrelated to the presence of any other feature. It predicts the probability of different classes based on various attributes. The class with the highest probability is considered the most likely class.
Naive Bayes is not a single algorithm, but multiple algorithms where all of them share a common principle, all based on Bayes' Theorem.
6. k-Nearest Neighbors
Source: rapidminer
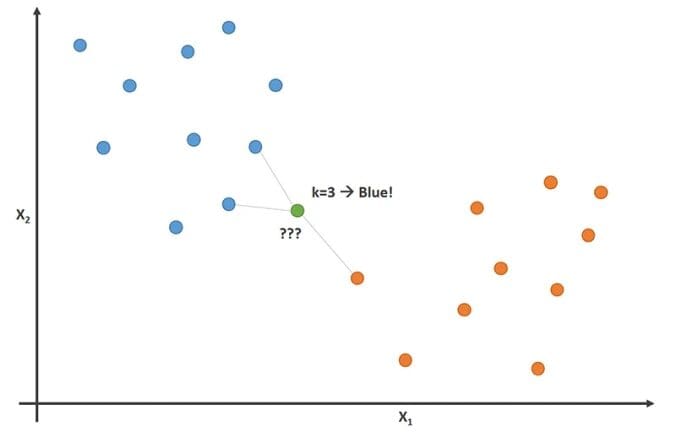
kNN, short for K-nearest neighbors, is an algorithm that branches off supervised machine learning which can be used to solve both classification and regression problems. The KNN algorithm assumes that similar things exist in close proximity. I remember it as the birds of a feather flock together.
kNN uses the concept of similarity between other data points using distance, proximity, or closeness. A mathematical approach is used to calculate the distance between points on a graph, where it then labels the unobserved data based on the nearest labeled observed data points.
In order to find the closest similar points, you will need to find the distance between the data points. This can be done using distance measures such as Euclidean distance, Hamming distance, Manhattan distance, and Minkowski distance.
The K is referred to as the number of nearest neighbors, where it is generally an odd number.
7. K-Means
Source: Wikimedia
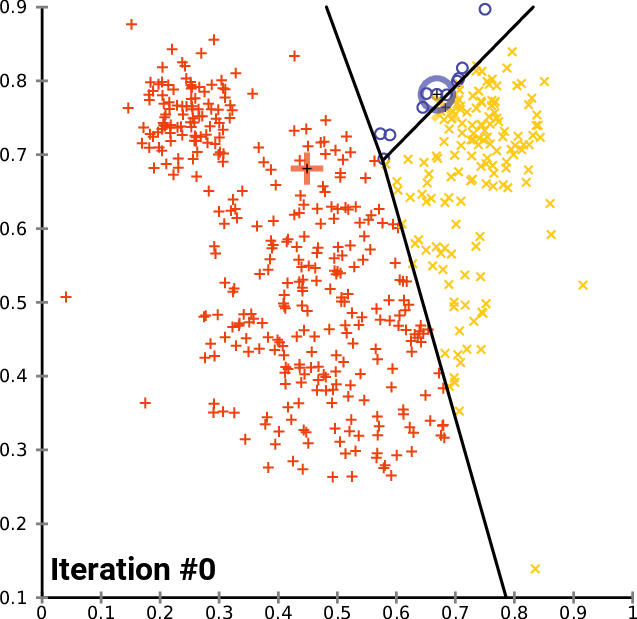
K-means clustering is a type of machine learning algorithm that branches off unsupervised learning. It is a clustering algorithm that groups similar items/data points in the form of clusters, where the number of groups is referred to as K.
Data points inside the cluster are considered homogeneous and heterogeneous to peer groups.
K-means finds the similarity between these data points and groups them into the clusters by:
- Select the k values.
- Initialising the centroids.
- Select the group and find the average.
In order to determine the k-value, you can use two methods:
- Elbow Method
- Silhouette Method
8. Dimensionality Reduction
Source: TDS
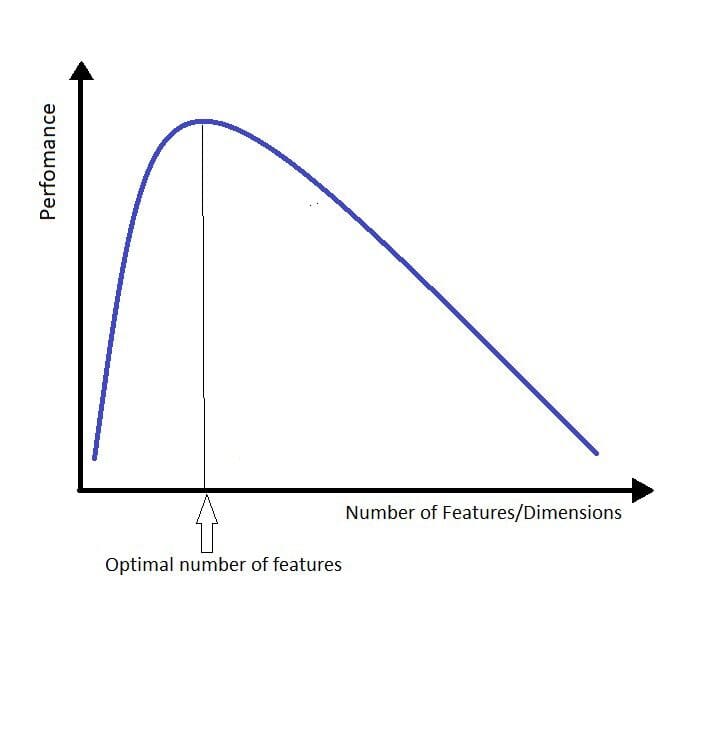
Dimensionality reduction is a technique used to reduce the number of input variables in training data. In layman's terms, it is the process of reducing the dimension of your feature set. Let's say you have a dataset with a hundred columns, dimensionality reduction will reduce the number of columns down to twenty.
When the number of features increases, the model automatically becomes more complex, and the higher chances of overfitting.
The curse of dimensionality is the biggest problem when it comes to working with data in higher dimensions, and refers to when your data has too many features.
Dimensionality reduction can be achieved by using the following components:
- Feature selection is used to identify and select relevant features
- Feature engineering manually generates new features using existing features.
Methods for Dimensionality Reduction include:
- Principal Component Analysis (PCA)
- Linear Discriminant Analysis (LDA)
- Generalized Discriminant Analysis (GDA)
Conclusion
Now you have a good understanding of the popular machine learning algorithms used in the day-to-day lives of Data Scientists.
If you would like to know which resources to further build your knowledge, have a read of this article: Machine Learning books you need to read in 2022
RANDOM FORESTS and RANDOMFORESTS are registered marks of Minitab, LLC.
Nisha Arya is a Data Scientist and Freelance Technical Writer. She is particularly interested in providing Data Science career advice or tutorials and theory based knowledge around Data Science. She also wishes to explore the different ways Artificial Intelligence is/can benefit the longevity of human life. A keen learner, seeking to broaden her tech knowledge and writing skills, whilst helping guide others.