I overheard a conversation at a conference lunch table recently. It went something like this:
Smart, hardworking person #1: I love the idea of using data to drive decisions, but spreadsheets can be such a drag. It takes forever to finish all the monthly reports that my organization is required to submit.
Person #2: Agreed. Spreadsheets totally suck. Just figuring out the ‘average’ scores takes too long.
#1: I have to type all the numbers into my calculator to add them up…
#2: … and then count how many people are included! Right! And divide by that number! And then I have to do those same tallies again the next month.
Oh noooooooooo!
A tiny piece of my soul crumbles every time I hear these comments.
You were put on this planet to do more than manual data analysis.
There’s a better way.
I love Excel, but that doesn’t mean I want to spend more time than necessary using it. Instead, I use these time-saving strategies to save my limited mental energy for tasks that are more important.
Here are four statistical formulas that every spreadsheet user should know.
(There are many, many, many additional formulas that you show know. But this is a good place to get started.)
Statistical Formula #1: Calculating the Average or Mean
Ten years ago, I was a consultant to Federal and state education agencies, so my brain is still packed full of education-related datasets. Humor me and pretend like you work on similar datasets for a minute. (The formula is the same regardless of your content area.)
Let’s pretend you want to calculate the average (a.k.a. mean) score for students.
Think back to high school math class: To calculate the average, you add up all the scores and then divide that sum by 5 because there are 5 students in the group. These are the steps that the poor conference-goers were doing by hand with their calculator.
Let Excel’s =average() function handle the calculations for you.
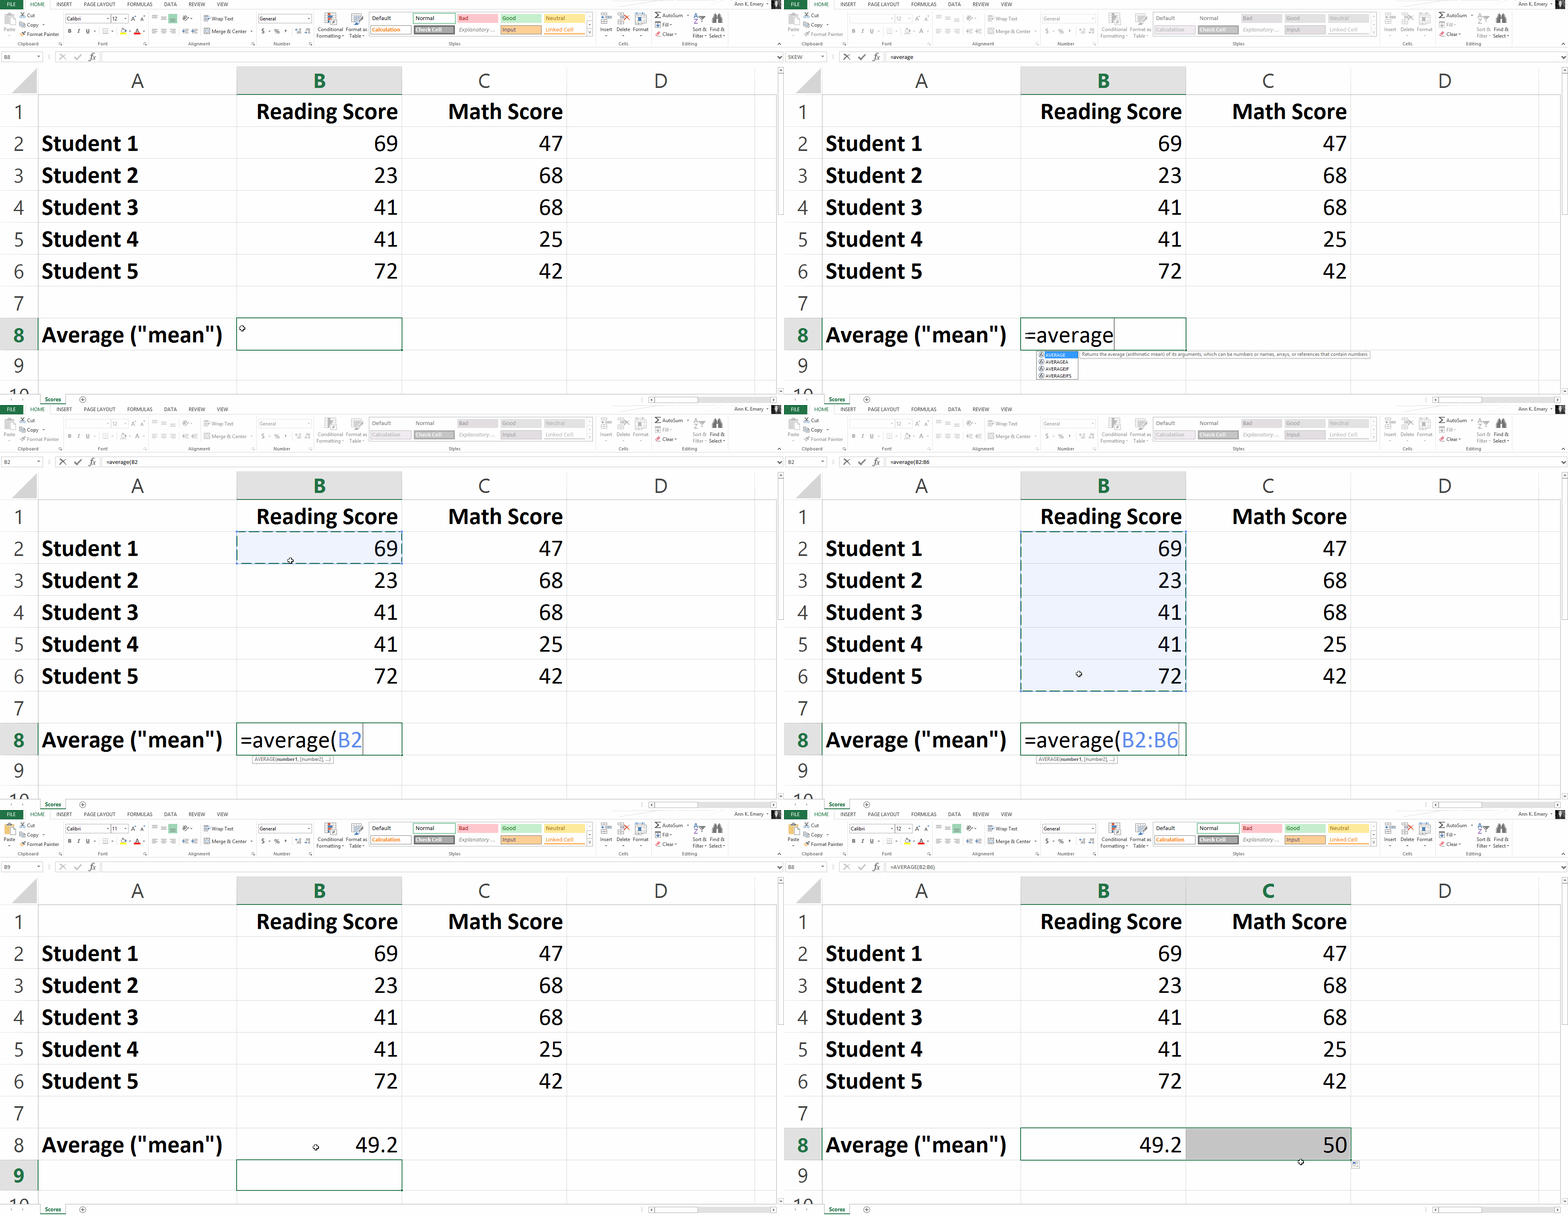
Type =average( and then click on the range of scores (so B2 through B6 for the reading scores). Add a ) to the end of the function and press Enter on the keyboard.
Your function will say =average(B2:B6) and the result is an average score of 49.2.
Once you calculate the average reading score in Column B, you can also drag that function over to the right to find the average math score, as I demonstrate below.

This is a simple dataset with just 5 scores, but the formula works the same with huge datasets of thousands of entries, too. Sometimes people worry that data analysis gets more complicated with larger datasets. Not necessarily. Formulas just become more critical on larger datasets. It’s time-consuming to do manual calculations on small datasets, and it’s impossible to do manual calculations on large datasets.
Statistical Formula #2: Median
You remember the median from high school math class, too, right?
Think of a median as a middle value. You sort the dataset from the smallest number to the largest number. The median is the number in the middle of that list.
Medians aren’t just nice-to-have calculations—they’re critical for reporting on skewed distributions. But that’s a post for another day… unless you want to comment on this blog post and practice giving your best explain-it-to-your-kindergartener explanation of a normal vs. skewed distribution, and a mean vs. median? Go for it, brave friends.
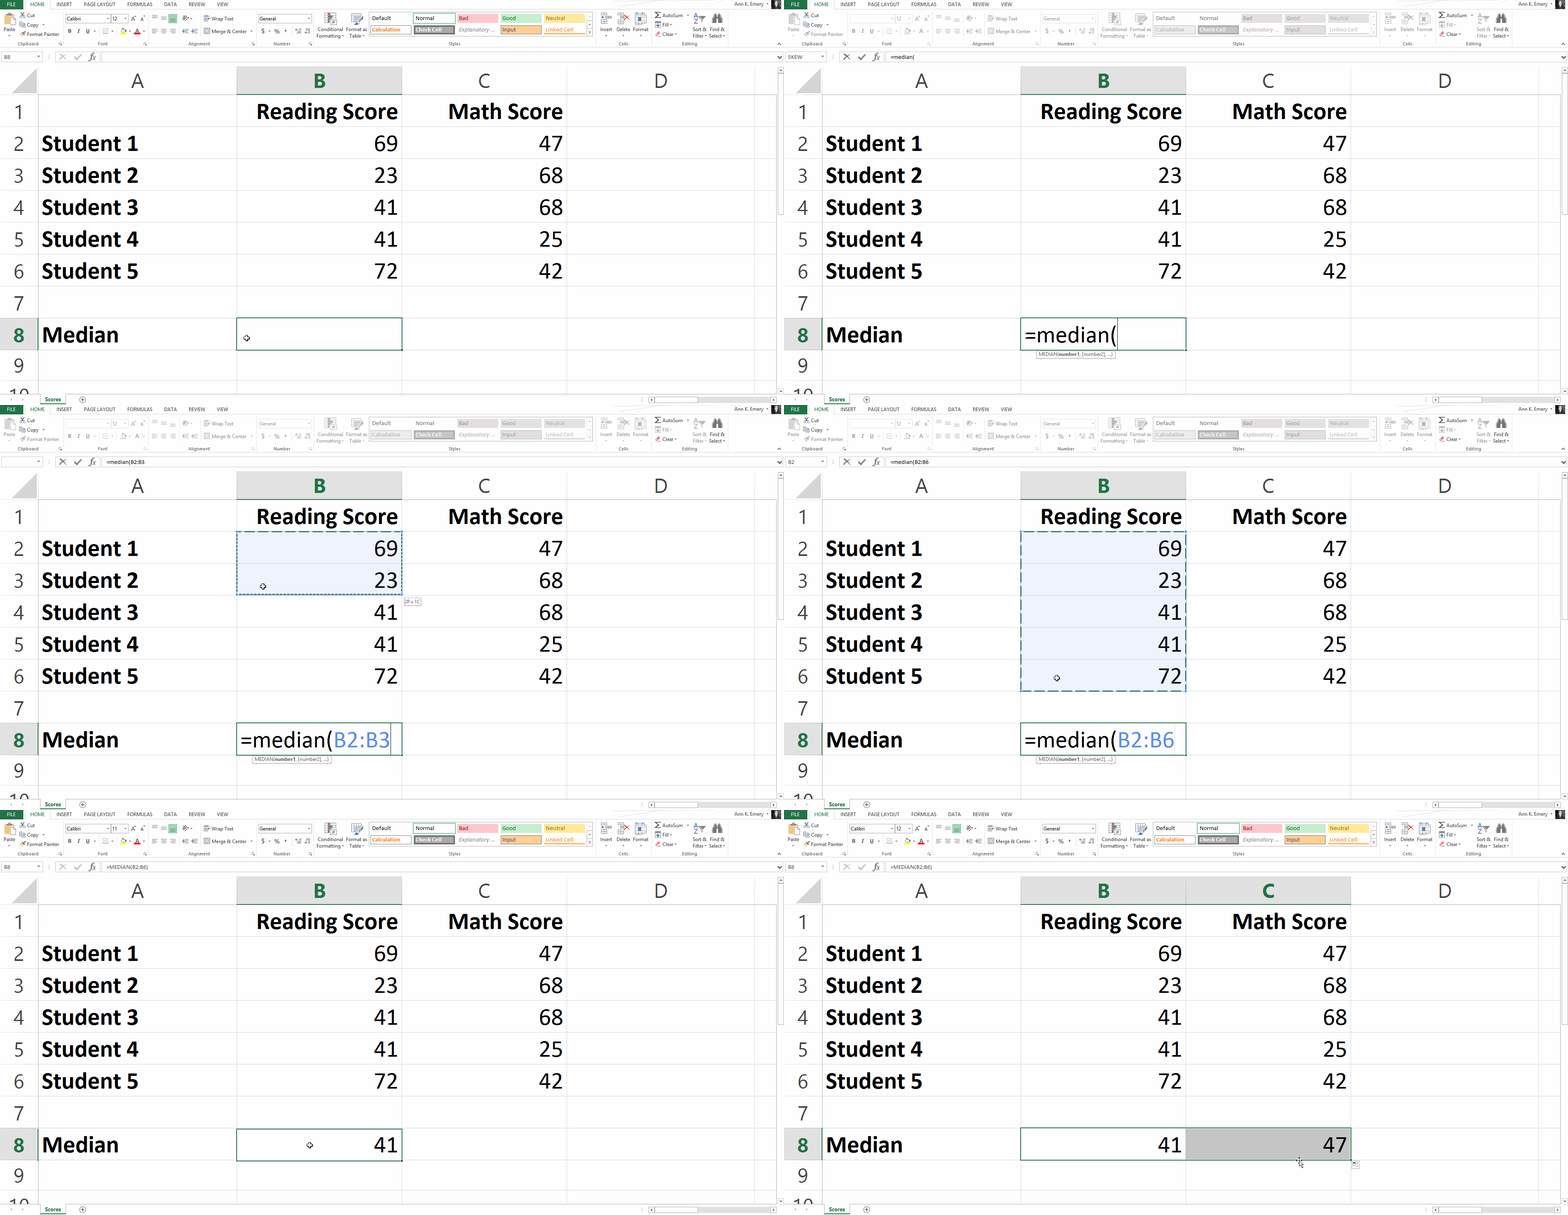
To calculate the median reading score, type =median(B2:B6) into cell B8 and press Enter.
You’ll get a result of 41.

Over the years, I’ve heard a few of my workshop participants wonder if the median still works even if your spreadsheet isn’t sorted from smallest to largest first. Yep, it still works! Excel does the behind-the-scenes sorting for you. That’s built into the formula. Your computer scans that section of numbers… sorts it… and finds the middle value. Your numbers can be in any order whatsoever.
Statistical Formula #3: Mode
The mode is the most-occurring number in a set of numbers.
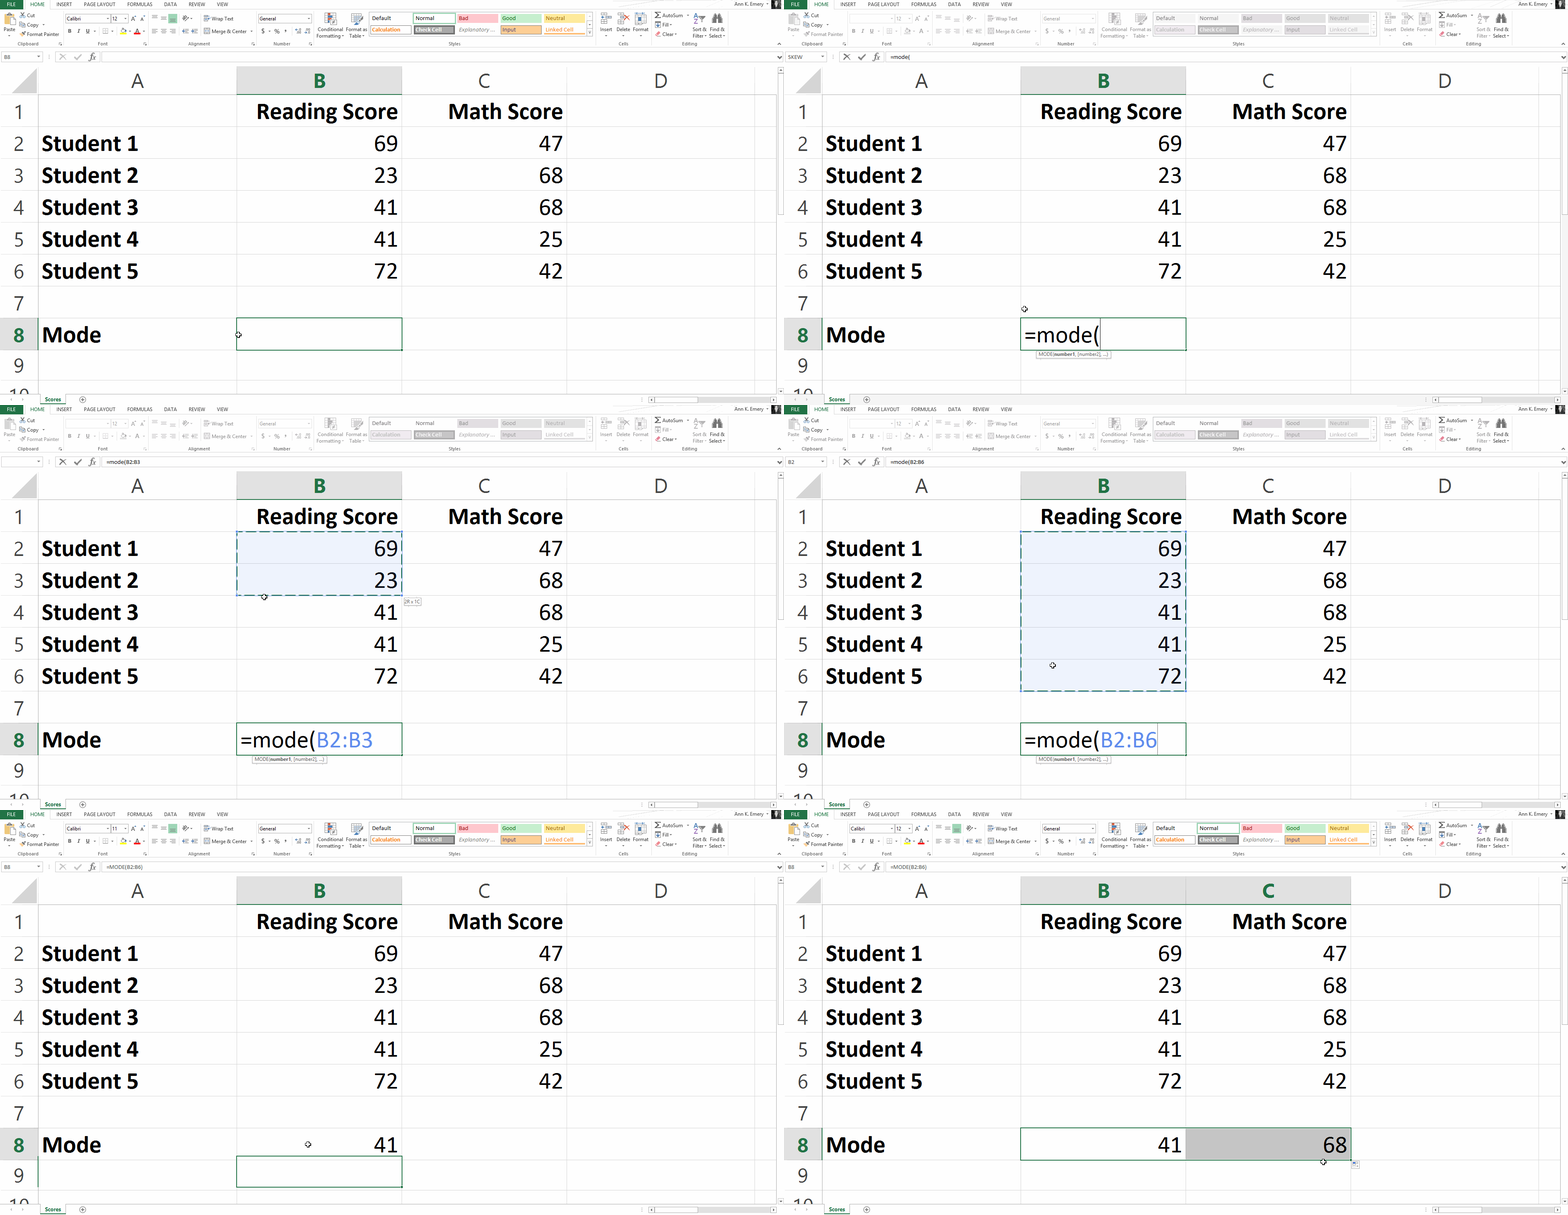
To find the mode for this sample dataset, you would type =mode(B2:B6).
The most common reading score is 41 and the most common math score is 68.

Statistical Formula #4: Standard Deviation
Remember the term standard deviation from your high school math class?
The standard deviation basically measures how stretched out your set of numbers is.
Is there a bunch of reallllllly small numbers along with a bunch of realllllly big numbers? Or are the numbers all fairly similar across the board?
A higher standard deviation means the numbers really vary, while a small standard deviation means the scores are pretty similar to one another.
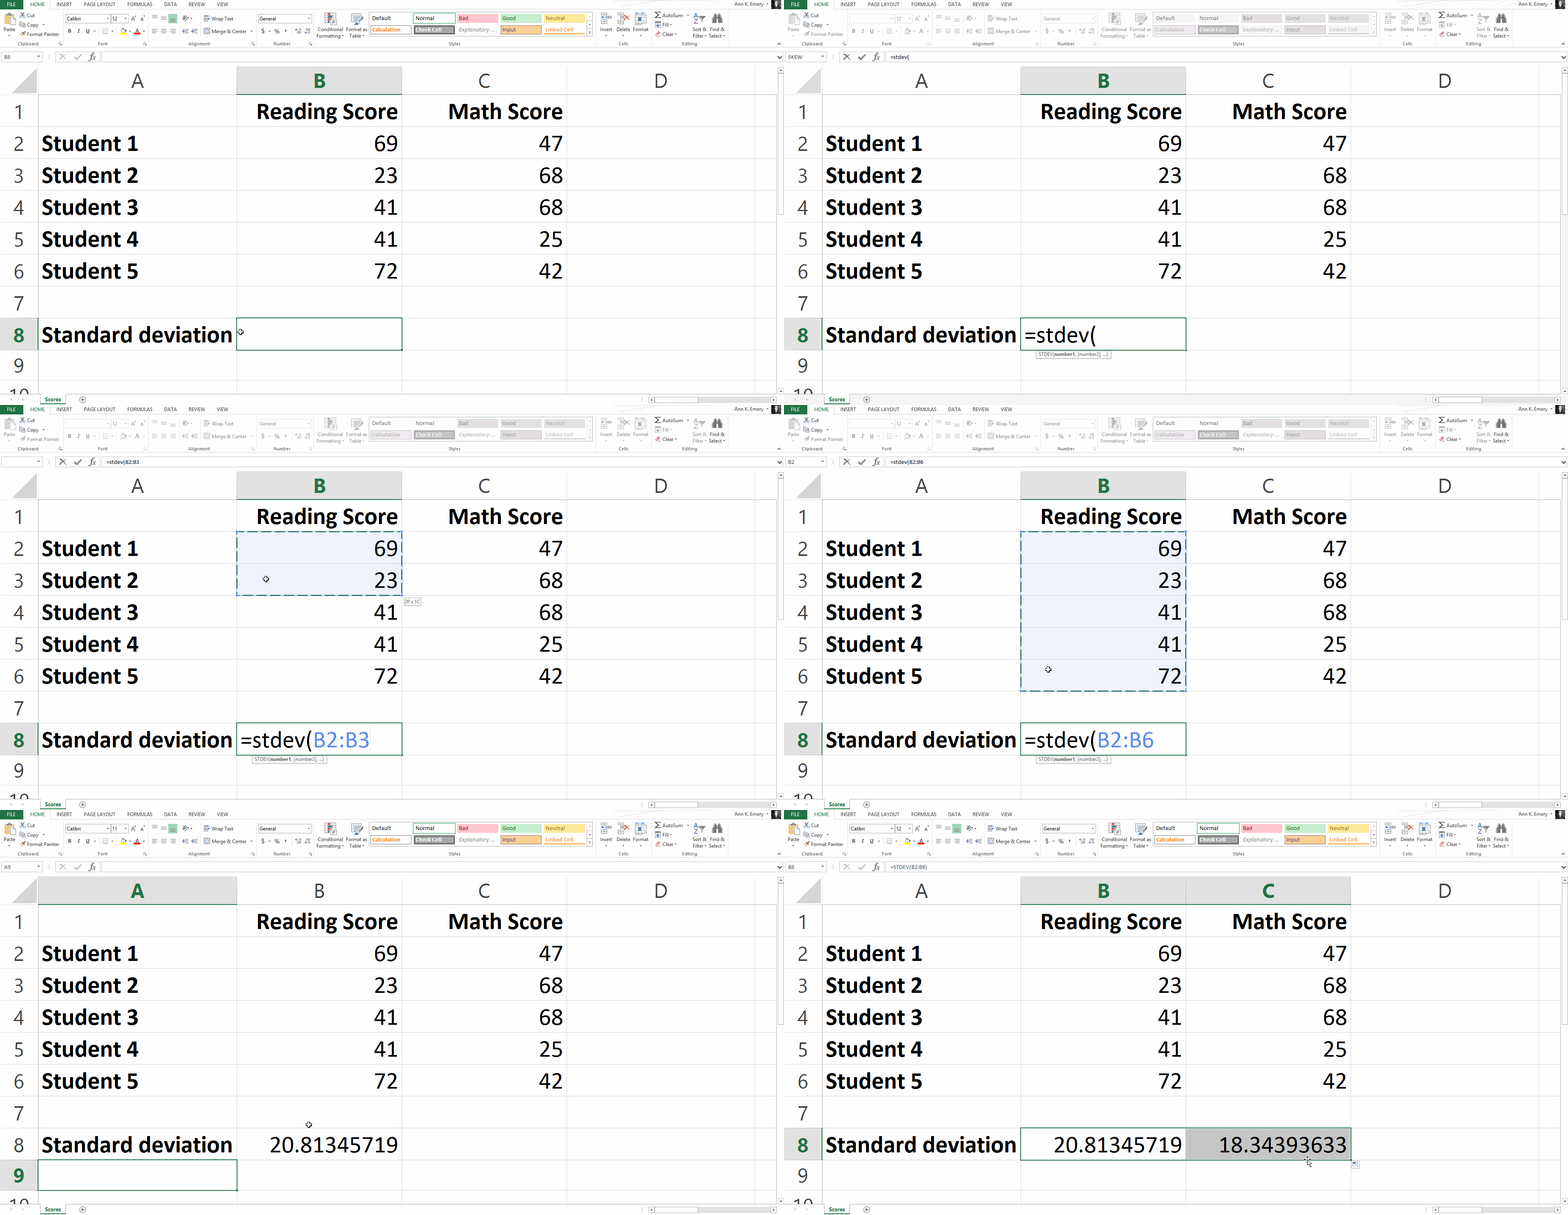
To calculate the standard deviation for our sample numbers, you would type =stdev(B2:B6) and get a result of 20.8.
Fellow data friends, I challenge you to comment on this blog post with your best explain-it-to-your-kindergartener definition. Phew! This is a hard term to describe!

Feeling Good??
I try to vary my blog content between beginner and advanced topics. This post is purposefully towards the beginner end of the spectrum.
Some of you work in spreadsheets all day every day like me, and you can do these formulas (and a million more) in your sleep. Other people are only in spreadsheets once in while because they’re busy leading organizations, writing grants, and managing teams of staff.
Occasional spreadsheet users, this post is for you! I hope you got a confidence boost and realized that you’re already on the right track with your current spreadsheet knowledge.
Your Turn
There are so many useful spreadsheet formulas. Comment below with your favorite formula, especially the formulas you think the occasional spreadsheet users would get the most benefit from.


2 Comments
Great article.
Scores A Scores B
47 47
48 48
49 49
50 50
52 88
average 49.2 56.4
median 49 49
std dev 1.92 17.70
We have scores of two batches, A and B.
All students score similar except one student.
This change in one score , makes a significant change in standard deviations of both batches score, some change in average , while no change in median.
A number which is unusually different from others, is considered as outlier. Averages and standard deviations are impacted by outlier whereas median is not impacted by outliers.
Regarding Statistical Formula #2: Median, one way to think about it is to consider a team of rowers, say eight men and a coxswain to steer, who need to carry the “eight” (8-person scull) to the shore. Imagine that they are carrying it on their shoulders, except the cox is shorter and lighter, and her shoulders aren’t high enough. She has the vital steering and time-keeping jobs and doesn’t need lots of muscle to row.
If you wondered what the average weight is, you’d add them all up and divide by nine, but the answer would be skewed low by the cox, who is smaller in stature.
Whereas, if the nine people were carrying the boat in order of heaviest at the back, to lightest at the front, with the cox leading the way, the median value would be the weight of the person in the middle of the line. As a bonus, the hull of the boat would indicate a trendline of the rowers’ heights! 😃