For designing machine learning (ML) models as well as for monitoring them in production, uncertainty estimation on predictions is a critical asset. It helps identify suspicious samples during model training in addition to detecting out-of-distribution samples at inference time.
In this blog post, we introduce the conformal prediction framework. It provides ML practitioners with a simple and model-agnostic measure of uncertainty for every sample prediction with predictions regions.
We validate this measure of uncertainty by computing the change of error rate for samples with large prediction regions compared to all samples by benchmarking it on a collection of datasets. Last but not least, this post comes with code snippets for implementing and using conformal predictions.

 Uncertain landscape (credit: Pexels)
Why Uncertainty Is Important
Epistemologically, the very notion of uncertainty is at the core of statistics and machine learning, and its interpretation at the root of the divide between frequentists and Bayesians.
More practically, for every decision-making process powered by machine learning algorithms, it is crucial to support a prediction with a level of confidence. Indeed, as metrics provide us with a global level of confidence for machine learning algorithms, it is natural to look for similar local levels of confidence at the sample level.
Bayesian models naturally give such local levels of confidence with posterior probabilities, and both aleatoric and epistemic uncertainties can be modeled (see this seminal paper on Bayesian Deep Learning from Kendall and Gal).
But as long as the bayesian machinery doesn’t take over the world of machine learning, how can we build local levels of confidence?
Most uncertainty methods are model-specific by design (Mondrian forest trees, quantile regression trees for non-deep learning algorithms) or incorporated during the initial model training through an additional branch or specific loss ([DeVries] and [Corbière et al.]).
With Occam’s razor as our guiding principle, we are looking for simple uncertainty estimation techniques for samples predictions. Striving for universality, we also require the techniques to be generic, i.e., agnostic to the underlying machine learning model, and come with no additional cost — that is, does not require any additional training.
We will show that the conformal predictions framework is a good candidate to fulfill those specifications. But first, let’s see why canonical calibration methods fall short.
Why Calibration Is Not Enough
With the output scores of classifiers being between 0 and 1, they are immediately interpreted as probabilities. But of which events? To fulfill the underlying frequentist reading of those scores, samples with predicted probability p should have an observed frequency of belonging to the positive class to be precisely p.
More formally, the canonical calibration property can be defined as:
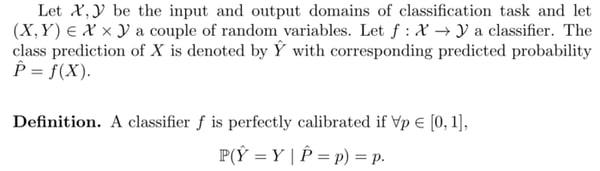 Canonical calibration definition
Calibration is a post-processing operation of the predicted probabilities to try satisfy this condition. The two most popular calibration techniques are Platt scaling and isotonic calibration. We refer to the extensive reviews and benchmarking of [Guo et al.] and [Snoek] on calibration of neural networks and the performance of various calibration methods for a more in-depth discussion.
For classification tasks, having calibrated probabilities is often a requirement for models used in decision-making processes (loan approval, fraud detection, etc.).
If calibration is agnostic to the classifier it is applied to, it is not a fine-grained enough notion of uncertainty. Firstly, calibration does not yield perfectly calibrated probabilities, but only better calibrated probabilities. Secondly, it is still a point-estimation and thus does not carry the expected attributes of uncertainty estimation.
Conformal Predictions: From Point-Estimation to Set-Estimation
This intuition of what uncertainty quantification should entail is materialized with intervals around predictions, whether confidence intervals for the frequentists or credible intervals for the bayesian.
Conformal predictions [Vovk] is a classical frequentist approach around hypothesis testing that provides error bound on a per-instance basis without specifying prior probabilities. Conformal predictions produce error bounds around the predictions. For regressors, those regions are intervals around the prediction. For classifiers, conformal predictions are set-valued predictions in the power set of the classes.
The underlying intuition is that inputs less similar to training data should lead to less certain estimates: this is captured by nonconformity scoring functions. For classification tasks, standard nonconformity measures borrow from uncertainty measures such as least confidence score (1 — the predicted probability) or smallest margin. Another nonconformity measure is the ratio of distance to the nearest neighbors with the same class by the distance to the nearest neighbor with different labels.
Example. A conformal prediction on the iris dataset with classes {setosa, versicolour, virginica} can be any of the subset of classes: empty, {setosa}, {versicolour}, {virginica}, {setosa, versicolour}, {setosa, virginica}, {versicolour, virginica} and {setosa, versicolour, virginica}.
This extension of point-estimation to set-estimation naturally carries a notion of uncertainty. A sample with multiple classes prediction means the classifier has trouble distinguishing between those classes. At the extreme ends of the spectrum, a sample’s conformal prediction can be empty (no class assigned) or full (all classes assigned).
Let’s set up notations and state the fundamental theorem of conformal predictions.
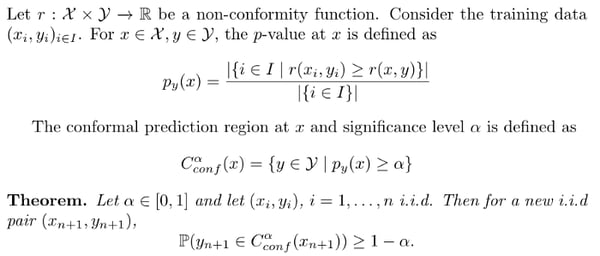 Fundamental theorem of conformal predictions
Example. On the binary classification task of the electricity dataset, the distribution of p-values for the least confidence nonconformity score is shown in the graph below.
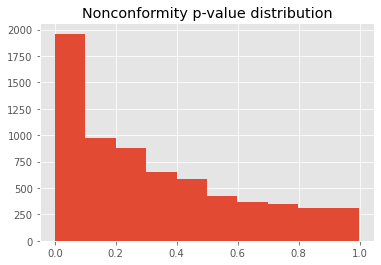 Least-confidence nonconformity score distribution
Measuring Sample Uncertainty With Credibility and Confidence
Two notions help quantify uncertainty for conformal prediction at the sample level.
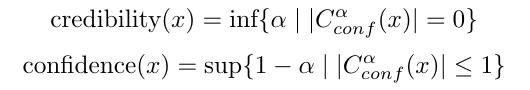
- Credibility measures how likely the sample is to come from the train set, this is given by the minimal significance level such that the conformal region is empty.
- Confidence estimates how certain the model is that the prediction is a singleton.
They are computed as follows:
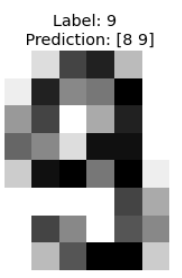
Example. For the MNIST sample below, we have two non-zero p-values for class 8 and 9: p_8=0.077, p_9=0.15. This sample has high conformal confidence 0.93 but a rather low credibility of 0.15.
Interpreting the Fundamental Theorem of Conformal Predictions
Interestingly, conformal predictions work in the opposite direction of most uncertainty methods. The level of acceptable uncertainty is first defined, and the predictions are made accordingly.
Note that this is a distribution-free statement and that the coverage validity of the prediction set does not depend on the choice of the nonconformity function. But a poor choice — like a random function — will lead to large prediction sets.
The parameter alpha is the tolerance error: the smaller it is, the less tolerance we allow and the prediction set has a higher chance of containing the true label.
The theorem should not be interpreted as claiming that the probability for a sample prediction to be wrong is alpha. In the long run, the error rate will be alpha, where an error is when the correct label is not in the predicted label set.
For binary classifications with no null conformal predictions, there is no error on full-set predictions so that the remaining errors are for singleton prediction: the probability for those predictions to be incorrect is then much higher than alpha.
Transductive conformal predictors was the original approach, but as it requires retraining the model for each new sample, inductive conformal predictors were developed. They require the model to be trained only once and the conformal scores computed on set-aside data.
For least-confidence nonconformity score, here is how an inductive conformal predictor works:
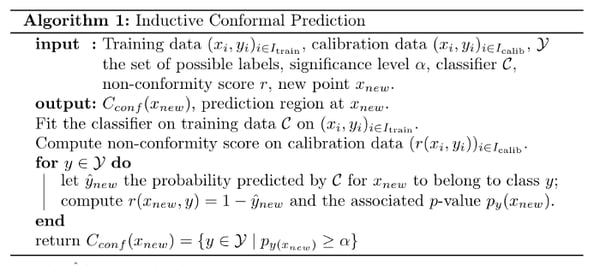 Inductive conformal prediction
Here is an example of implementation of the above:
Beyond Marginal Distributions for Conformal Predictors?
The guaranteed error rate of the theorem is over unconditional distributions. For imbalanced datasets, however, the minority class often presents a more difficult pattern to capture and leads to greater error rate than for the majority class. This motivated the introduction of label-conditional conformal predictors, for which nonconformity p-values are class-conditional:
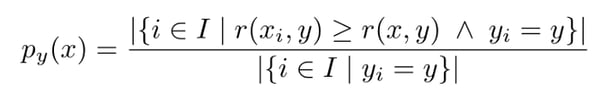 Label-conditional conformal p-value
Label-conditional conformal predictors have an analog coverage property conditioned on classes.
Here is a code sample that showcases label-conditional conformal prediction with least confidence nonconformity score on the digits dataset.
Example. Consider the standard digits dataset; after standard rescaling, we fit a Logistic Regression with default parameters. Below are samples of the digits dataset with multiple conformal predictions.
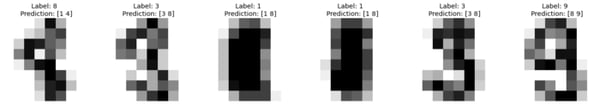 Label-conditional conformal predictions with least-confidence nonconformity scores at significance level 0.05
Calibration of Conformal Predictors
The theorem can be seen as a calibration property of conformal predictors. But this needs a careful interpretation, as there is no equivalent notion of calibrated probabilities or scores for conformal predictors. Reframing the theorem, we have the definition of perfectly calibrated conformal predictor:

In practice, it is often observed that conformal predictors are well calibrated. For smoothed p-values, conformal predictors are always perfectly calibrated (see Algorithm in a random world, Theorem 8.2).
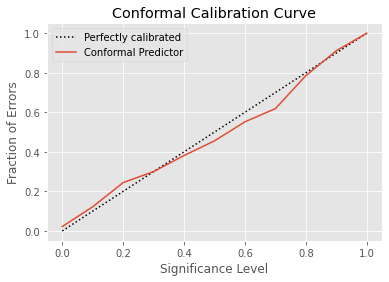
Here is the conformal calibration curve for the previous conformal predictor over the digits dataset.
What Makes a Good Measure of Uncertainty?
To the best of our knowledge, there is no universal metric that measures the quality of uncertainty estimation methods beyond calibration metrics (such as Brier score or ECE). One way to measure this is through a robustness study, such as this.
Another way to circumvent this is to look for proxies that can highlight what we expect from an uncertainty method. That’s why we use error analysis as a pretext task. More explicitly, samples with high uncertainty should be more error-prone than samples with low uncertainty.
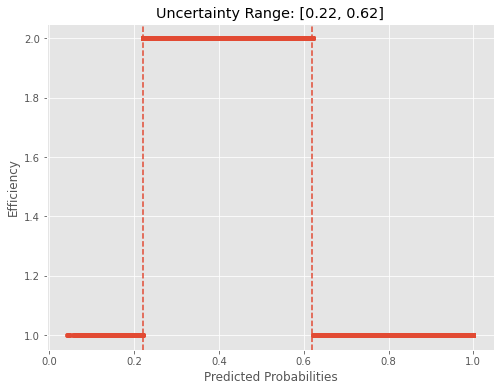
The size of prediction regions, referred to as efficiency, is a good notion of informativeness. A sample prediction is considered to have low uncertainty if it has low efficiency. For samples with efficiency higher than one, the prediction is considered to be of high uncertainty.
To put that to the test, we can look at how evaluation metrics change for different efficiency values by computing stratified metrics over subsets of data with given efficiency. We encapsulate this with the conformal error ratio, defined as the following bayes update ratio:
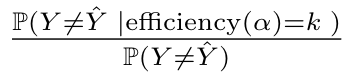 Conformal error ratio at given efficiency
For samples with a large prediction region, we expect this ratio to be large and similarly small ratios to be indicators of samples correctly classified.
Let’s see this in our previous example on the iris dataset. The error rate of the base classifier is 0.04 while the error rate on samples with efficiency higher than 1 is 0.28, hence the update ratio is 7. This means we are 7 times more likely to make an error on this sample subset than on the full dataset!
Benchmarking
It seems that the bayes update ratio is a good proxy for error detection on this classification task. To make this proxy more reliable, we study its behavior on a larger scale.
This experiment is extended to 22 binary classification datasets from the cc18 collection and iterated over 10 random seeds. For various significance levels (0.01, 0.05, 0.1, 0.2), we plot the conformal error ratio over efficiency on the left-hand side. To account for the cardinality bias, the right-hand side shows the corresponding size of each efficiency strata. Additionally, we plot the conformal error ratio constant to 1 (no additional information is provided by the efficiency) as baseline.
The reported results are the means over random seeds together with standard deviations.
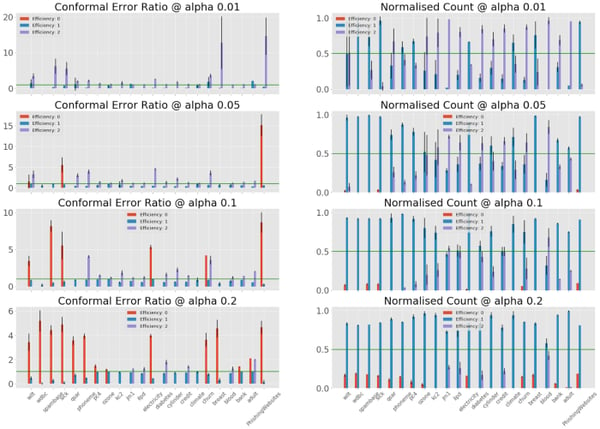 Experiment results over 22 classification tasks
The conformal error ratio appears to be a robust indicator of error rates, as this generalizes across the benchmarking datasets. The zero efficiency strata have strictly larger than 1 conformal error ratio (4.6 average), although they often represent a small fraction of all data (10% on average when not empty). If the full-efficiency strata (2) show less impressive ratios (2.4 average), they can account for a large part of the data (44% on average when not empty).
Conformal Predictions Takeaways
We have introduced the conformal predictions framework and saw how it represents an interesting choice of uncertainty measure. Conformal predictions are generic, as they can be applied to any machine learning model. The computation of conformal prediction is a negligible overhead at inference time with standard nonconformity measure. By providing local prediction regions, they offer uncertainty estimations at the sample level.
Conformal predictions can also yield global uncertainty estimations.With least confidence as a nonconformity score in a binary setting, looking at the interval of predicted probabilities for samples with full-set prediction is providing us with a simple global uncertainty rule. This can actually be used directly as an uncertainty proxy: all samples with predicted probabilities within that range should be carefully examined.
The motivations behind conformal predictions percolate in other bodies of work on uncertainty and robustness… even when no explicit mention to conformal prediction is made as in the NeurIPS 2018’s To Trust Or Not To Trust A Classifier(where the proposed so-called trust score is precisely a nonconformity score!).
Etymological Bonus
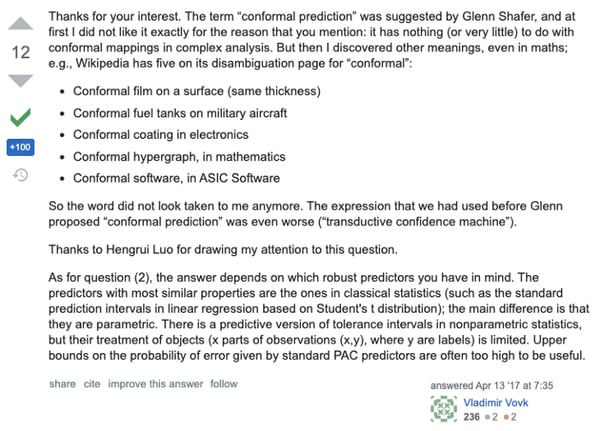
The conformal adjective is a bit mysterious and its motivation not clear. It has nothing to do with conformal maps in geometry. Thanks to StackOverflow, Vladimir Vovk himself explains the etymology behind his theory: