Cyberpunk Themed Charts: Advanced Data Visualization in Python
This article was published as a part of the Data Science Blogathon
Introduction
Visualization leverages the power of data in getting insights and crisp storytelling just from a pile of numbers and texts. We have come to an era where visualizing data is not a new thing among practitioners.
Today, one always focuses on building theme-based plots that are self-explanatory and best describes the genre of data used.
For example, if we are visualizing the monthly newspaper sales of a particular newspaper for the last year, we would use rather use Times New Roman or Franklin Gothic fonts than the default fonts to make it more apt to the data we are using. Also, we would add sepia background to make the plot self-explain itself.
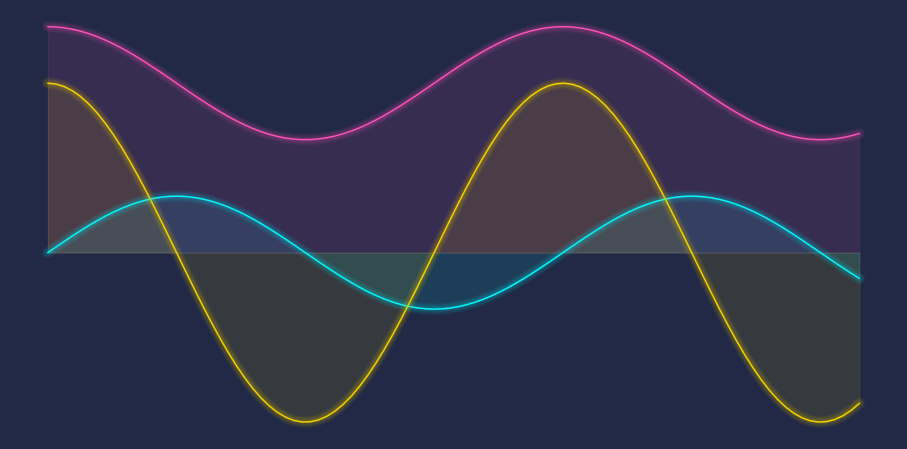
Image Source – Personal Computer
Imagine you want to visualize the video game sales of a new game launched last year. It would be very apt to make the plot more theme-based to get the user attention from the first glance. If we make the theme sci-fi or fantasy-based, it will closely resemble the kind of data we are talking about. In this article, we will plot the Cyberpunk style Line Plots which is a dark background and neon colour-based plot theme.
Table of Contents
- What is ‘Cyberpunk’
- Using Cyberpunk Style in Python
- Customize your Chart
- Conclusions
What is ‘Cyberpunk’
Cyberpunk is a fictitious genre of Science backed by technology resembling the dystopian future. Cyberpunk term is almost self-explanatory by the term ‘cyber’ which refers to tech. Cyberpunk does not have fixed meaning and many experts have introduced their own definitions. For us, it is enough to know cyberpunk as a Sci-FI and tech-driven environment. Visuals from Internet resources suggest that Cyberpunk is mostly composed of a lit and neon-coloured world with maximum Artificial Intelligence involvement.
Film Series such as Matrix Trilogy and Blade Runner Series is the perfect example of Cyberpunk themed Movies. Thus, we can say that Cyberpunk is not a new term and has been introduced to the world a long way back. This term is not only being limited to Movies but also is getting adopted as Video Games Genre. The infamous Cyberpunk 2077 Video Game launched in 2020 is completely set in a Cyberpunk environment.
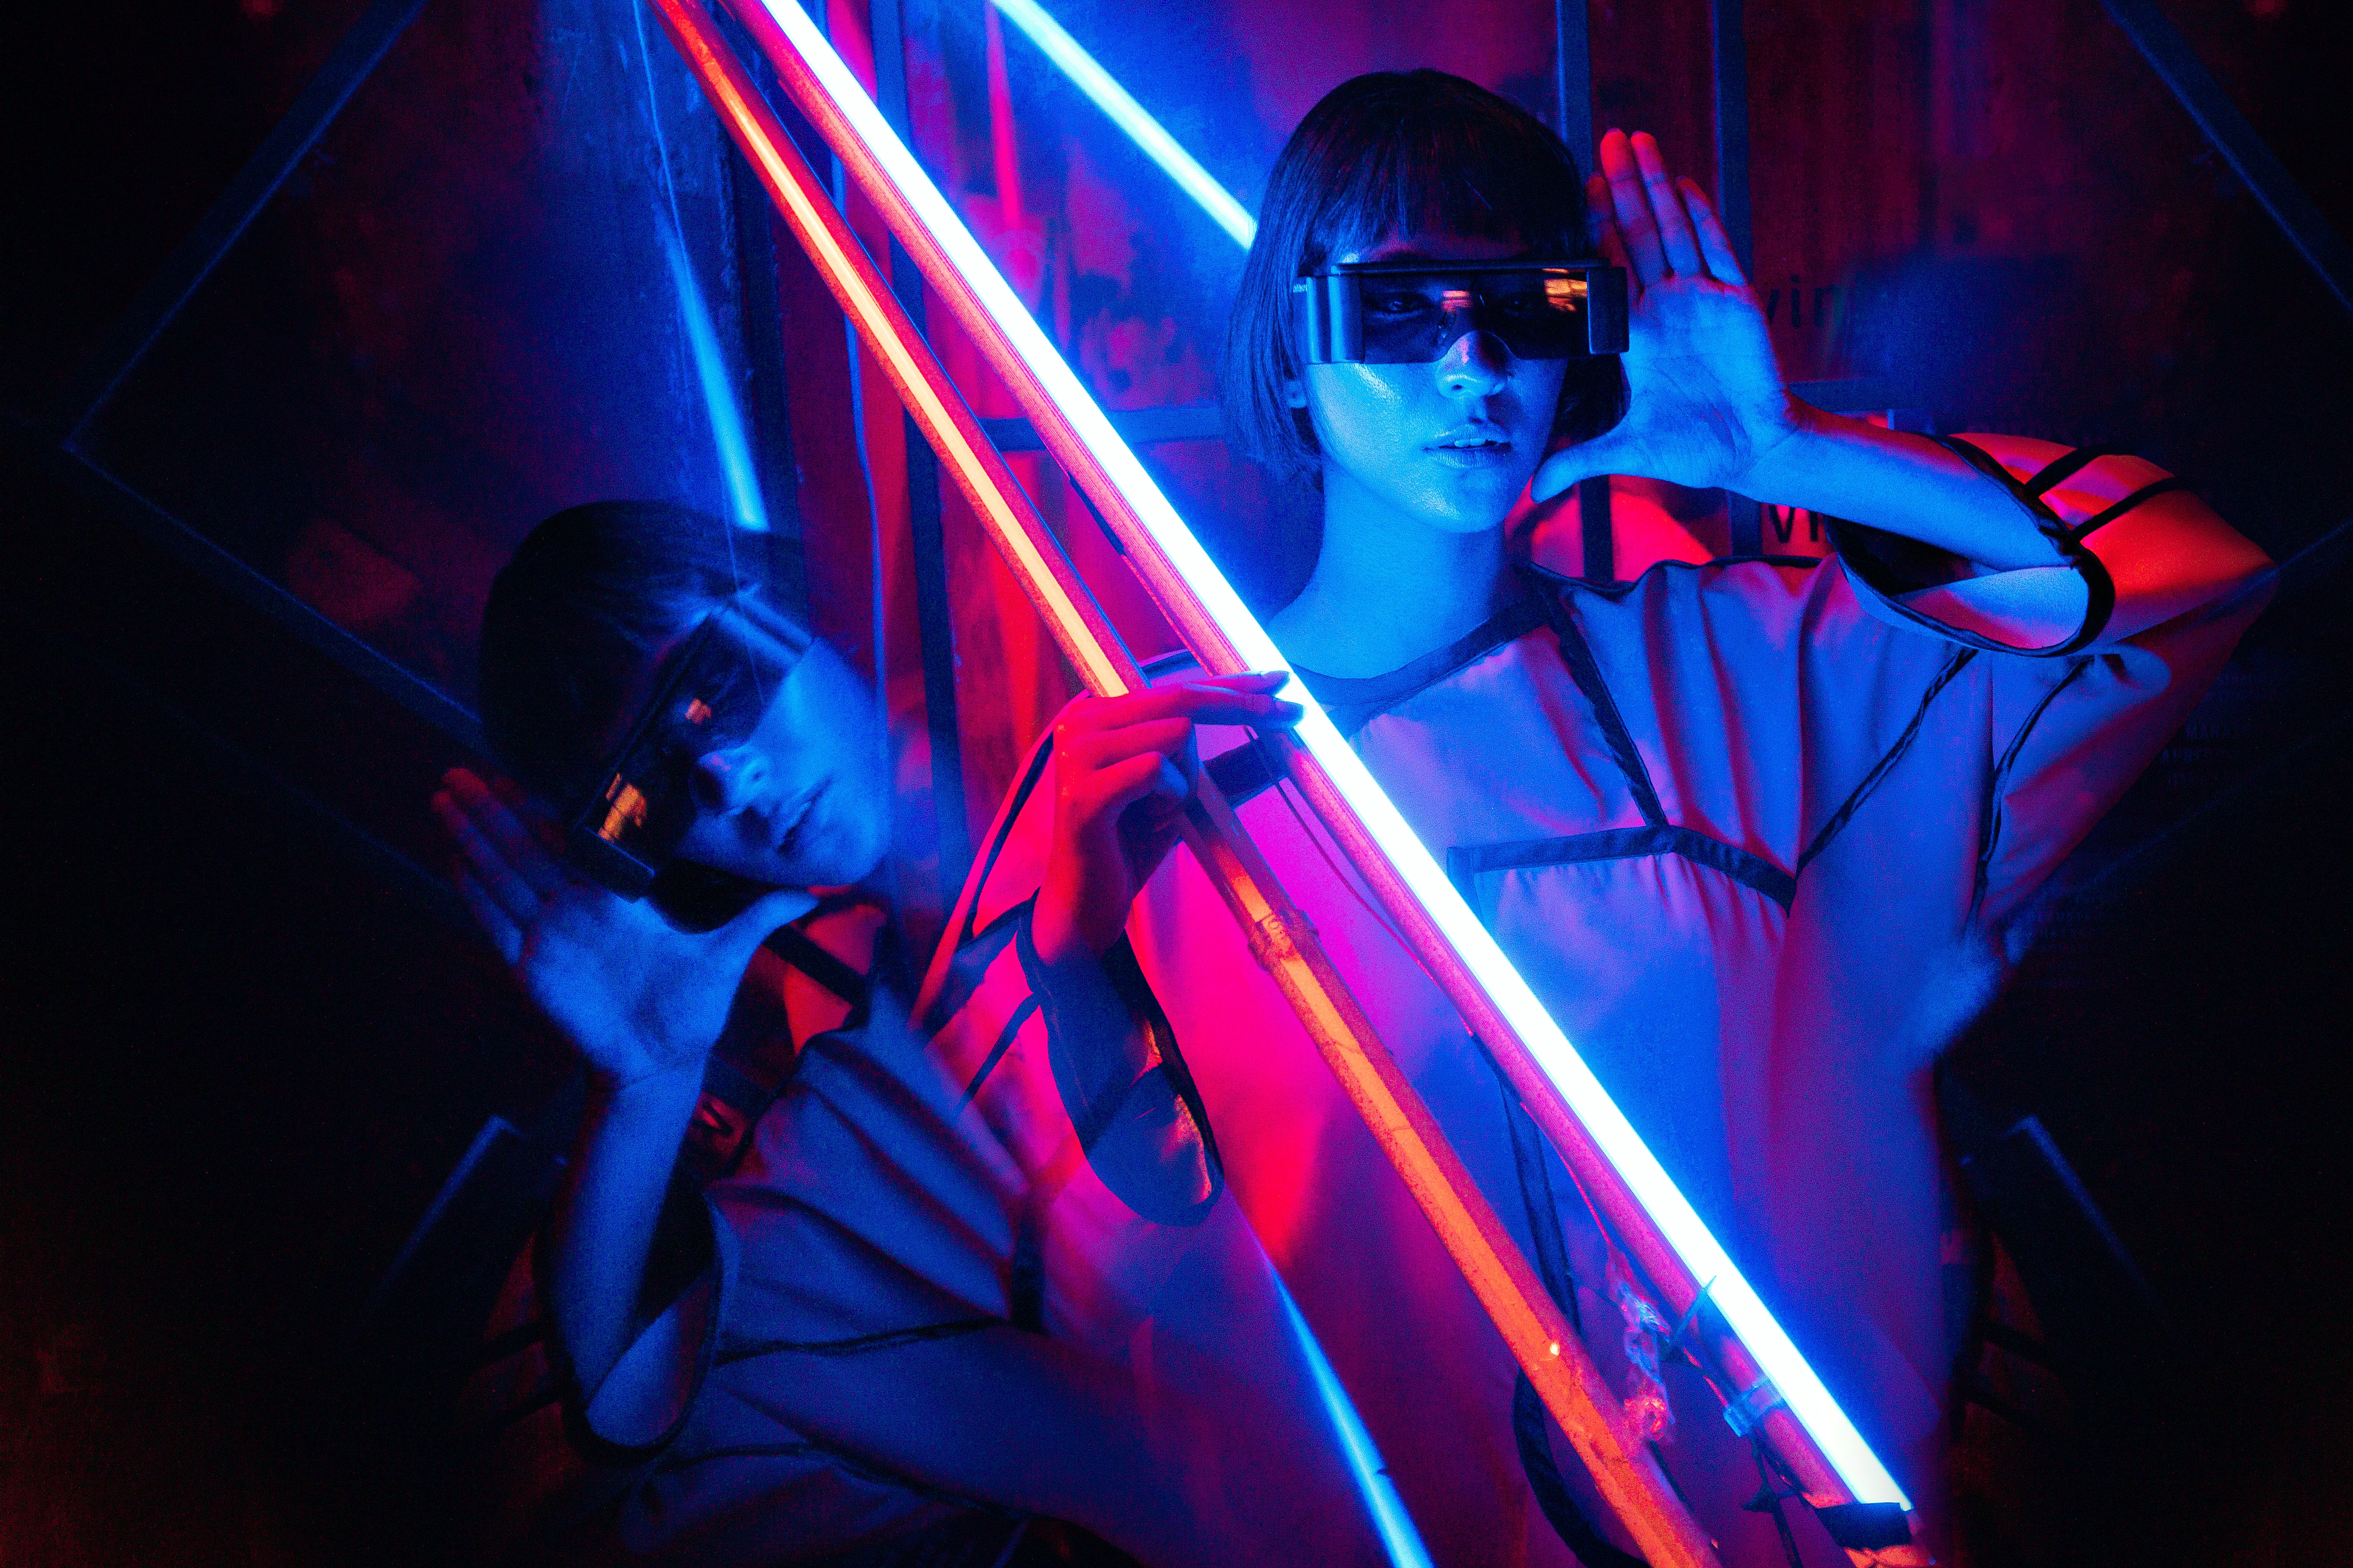
Image by Marcus Vinícius A. Ribeiro from Pexels
In this article, we will use Cyberpunk themes plots which too have a dark and lit environment with bright colors which can be customized up to a certain extent. Using Cyberpunk themed plots can be extremely useful when we want to plot some technology and AI-driven charts in our work.
Using Cyberpunk Style in Python
Plotting Cyberpunk Themed Charts in Python does not take much effort but a few lines of code. To use Cyberpunk styling, we need to fulfil some requirements. Apart from the basic plotting libraries, we need to install the mplcyberpunk library. This library has been introduced by Dominik Haitz and will act as a primary reference for the following article.
1. Installing the Libraries
pip install mplcyberpunk
2. Importing the Libraries
import matplotlib.pyplot as plt
3. Specifying the Matplotlib Stylesheet
Using this stylesheet, the chart layout will turn dark
plt.style.use("cyberpunk")
4. Plotting the Line Chart
plt.figure(figsize = (20,8))
plt.plot(np.random.randint(0, 8, 5), marker = 'o', )
plt.plot(np.random.randint(0, 8, 5), marker = 'o')
plt.plot(np.random.randint(0, 8, 5), marker = 'o')
plt.xticks(size = 16)
plt.yticks(size = 16)
5. Show the Final Plot
plt.show()
6. Putting it all together
Customize your Chart
The plot generated above is beautiful in itself, but there are certain things we can control in this plot. For the customization, we can add: glow to the lines, glow the area under the lines and glow both to lines and are under the lines.
Let’s first create s simple Chart without glow effects which will help us to make a difference
import matplotlib.pyplot as plt
import mplcyberpunk
plt.style.use('cyberpunk')
plt.figure(figsize = (20,8))
plt.plot([1,4,6,7,4,1], marker = 'o')
plt.plot([5,3,5,8,9,2], marker = 'o')
plt.plot([3,5,8,3,4,9], marker = 'o')
plt.xticks(size = 16)
plt.yticks(size = 16)
plt.show()
On executing this code, we get:
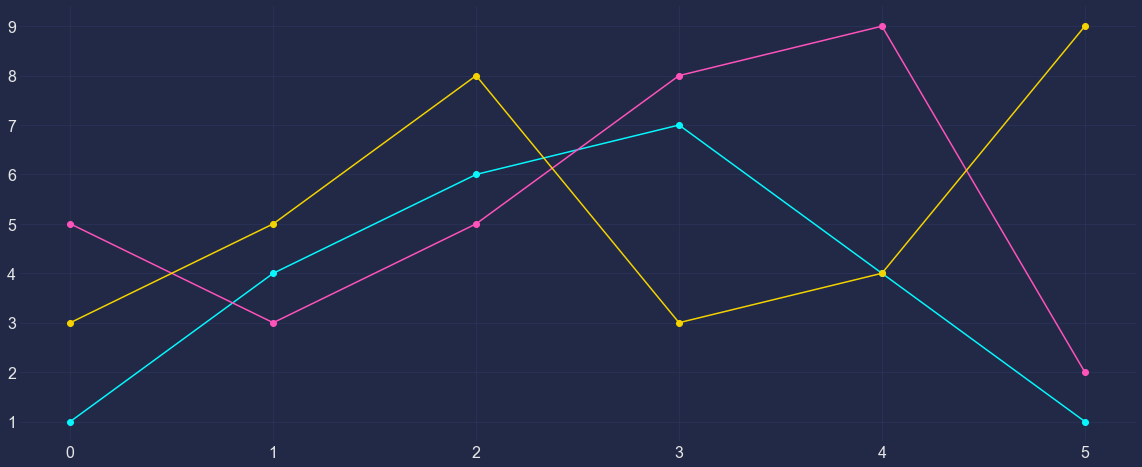
Image Source – Personal Computer
1. Adding Glow Effects to Lines
To add glow effects to lines in the chart, we will use the .make_lines_glow() method of the mplcyberpunk library.
import matplotlib.pyplot as plt
import mplcyberpunk
plt.style.use('cyberpunk')
plt.figure(figsize = (20,8))
plt.plot([1,4,6,7,4,1], marker = 'o')
plt.plot([5,3,5,8,9,2], marker = 'o')
plt.plot([3,5,8,3,4,9], marker = 'o')
plt.xticks(size = 16)
plt.yticks(size = 16)
mplcyberpunk.make_lines_glow()
plt.show()
On executing this code, we get:
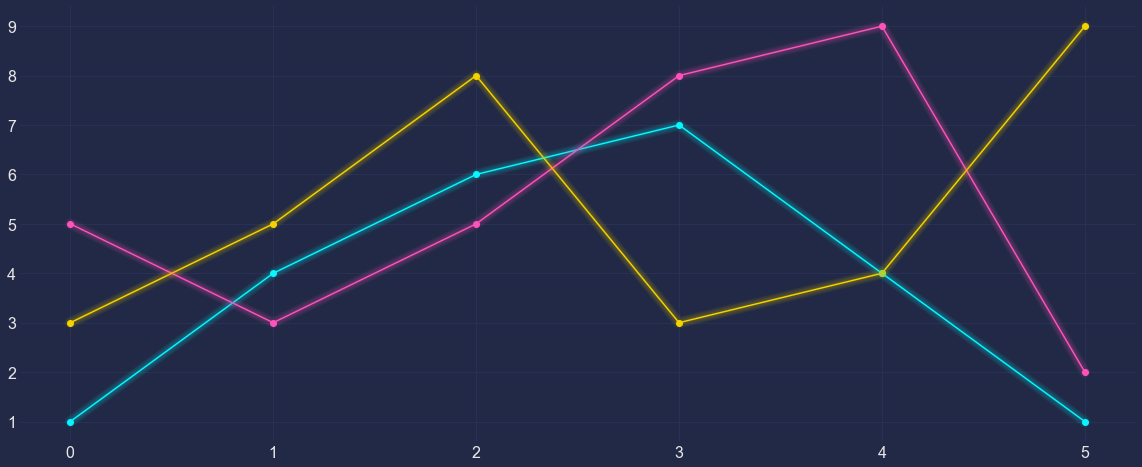
Image Source – Personal Computer
2. Adding Glow Effects to Area Under the Lines
To add glow effects to the area under the lines, we will use the .add_underglow() method of the mplcyberpunk library.
import matplotlib.pyplot as plt
import mplcyberpunk
plt.style.use('cyberpunk')
plt.figure(figsize = (20,8))
plt.plot([1,4,6,7,4,1], marker = 'o')
plt.plot([5,3,5,8,9,2], marker = 'o')
plt.plot([3,5,8,3,4,9], marker = 'o')
plt.xticks(size = 16)
plt.yticks(size = 16)
mplcyberpunk.add_underglow()
plt.show()
On executing this code, we get:
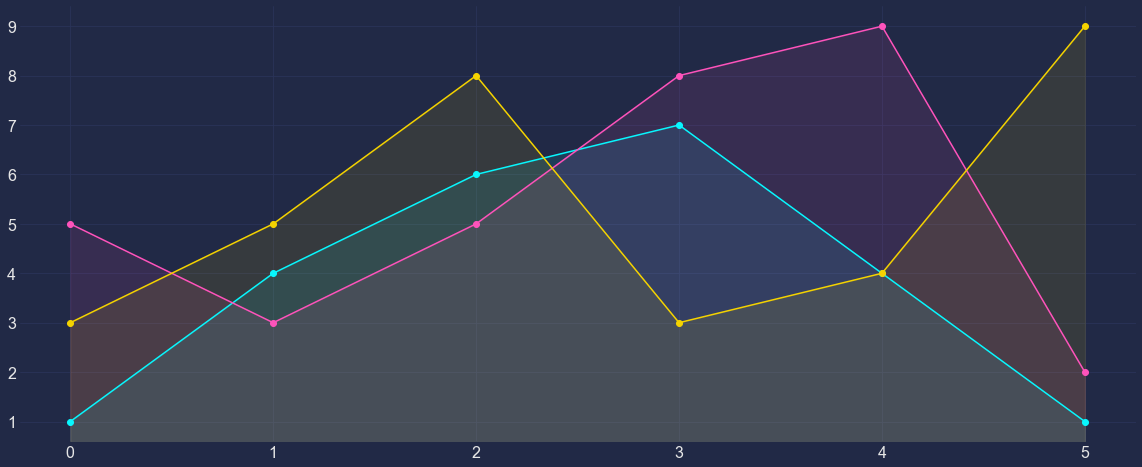
Image Source – Personal Computer
3. Adding Glow Effects to both Lines and Area Under the Lines
To add glow effects to the area under the lines, we will use the .add_glow_effects() method of the mplcyberpunk library.
import matplotlib.pyplot as plt
import mplcyberpunk
plt.style.use('cyberpunk')
plt.figure(figsize = (20,8))
plt.plot([1,4,6,7,4,1], marker = 'o')
plt.plot([5,3,5,8,9,2], marker = 'o')
plt.plot([3,5,8,3,4,9], marker = 'o')
plt.xticks(size = 16)
plt.yticks(size = 16)
mplcyberpunk.add_glow_effects()
plt.show()
On executing this code, we get:
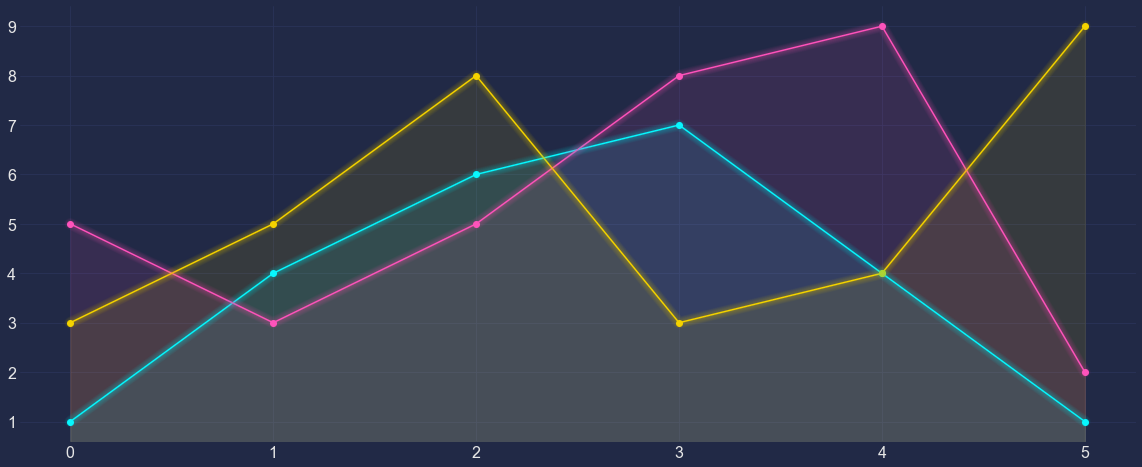
Image Source – Personal Computer
Conclusions
In this article, we learned, how to plot Line Charts in Cyberpunk themed stylesheet by adding glow effects to Lines and Area Under The Lines. At the moment, there is not very much we customize in the plots, but we can expect more in the future.
Apart from the Line Chart, we can also try plotting Bar Plots but can only use the Cyberpunk stylesheets as there will be no point in adding glow effects on the line or under the line. Apart from this, we can club several Matplotlib methods to increase the usability of our plot. If one is interested can keep an eye on mplcyberpunk to see the new releases and updates if arrives.
We can try plotting different patterns such as sin and cosine curves (Shown at the start) which look very fascinating and attention-worthy. We can also try plotting more different kinds of plots how it looks. It’s always good to try and experiment with things on your own because we always learn by doing.
About the Author
Connect with me on LinkedIn Here.
Check out my other Articles Here
You can provide your valuable feedback to me on LinkedIn.
Thanks for giving your time!
IT Engineering Graduate currently pursuing Post Graduate Diploma in Data Science.


This is really an insightful blog. Love your content a lot. Thank you for writing.