Build Your First Visualizer Tool using OpenCV
Introduction
In today’s world, we see thousands of great products, and multinational companies selling those products. But what’s common in all of them is how they have grown from an idea. Every day, dozens of ideas are stuck in our heads which cause us to think deep and dive into our imagination. From choosing a colour for our curtain to choosing an algorithm, we have to visualize it in our heads. Sometimes the hardest decisions are made within seconds and choosing a colour makes us think for hours. To eliminate the problem and to save our time, instead of binding what we think to our little brain, we can create a stronger picture with the help of visualizers and virtualizers.
What is a Visualizer?
A Visualizer is nothing but a tool that brings someone’s imagination to reality. It provides a hard picture of what the end product will look like. Suppose a company wants to create a car that flies and it needs investment for that. To pitch their idea, a visualizer will come into action. It will demonstrate the design of the car, how it will work and what will be the impact of it on the market. A visualizer is more like a tool that is used for the presentation of the actual product. Moreover, just like writing an algorithm helps in further code writing, a visualizer helps achieve the best end product.
Benefits and Applications
- A visualizer helps in saving cost and time.
- Because of Visualizers, lesser alterations are required in the product.
- It creates a more presentable structure of the end product.
- Many companies have started using visualizers to demonstrate their product to the user before they buy it. Hence, it also provides customer satisfaction and builds consumer’s trust in the company.
In this article, we will be creating one such visualizer, that will help us to try out various combinations of colors and patterns to our room walls. Through this visualizer, a user would be able to expand their imagination and choose the option best suitable to them. It may not look like what you expect but it’s enough to get your hands dirty with the concept.
We will be using OpenCV and some basic functions of NumPy for this task. At the end of the article, I will also be sharing the scope of improvement and parts where you can work, to make this project go to the next level.
The soul of the project is the mask we will be creating and the quality of the mask will determine the quality of results. So better the mask, better the results.
Here we go
1. We start by accepting the room image and the texture. They may not be of the same size as we will be going to resize them anyways. Then we will convert the image to HSV image format. Why HSV and not any other colour format? Check this. After that, what we need to do is grab the colour of the wall, filter out that color and create a mask image. To grab the colour of the wall, we will be creating mouse events using the cv2.setMouseCallback() function. We also have to create a click event function that will be called whenever the mouse comes into action.
import cv2
import numpy as np
def click_event1(event, x, y , flags, param):
        global draw, mask, lb, ub
        if event==cv2.EVENT_LBUTTONDOWN:
                print(img[y,x], hsv[y,x])
                lb = hsv[y,x]-10
                ub = hsv[y,x]+10
img = cv2.imread("room2.jpeg")
tex = cv2.imread("tex2.jpg")
img = cv2.GaussianBlur(img,(5,5),0)
hsv = cv2.cvtColor(img, cv2.COLOR_BGR2HSV)
cv2.imshow("img",img)
cv2.setMouseCallback('img', click_event1)
cv2.waitKey(0)
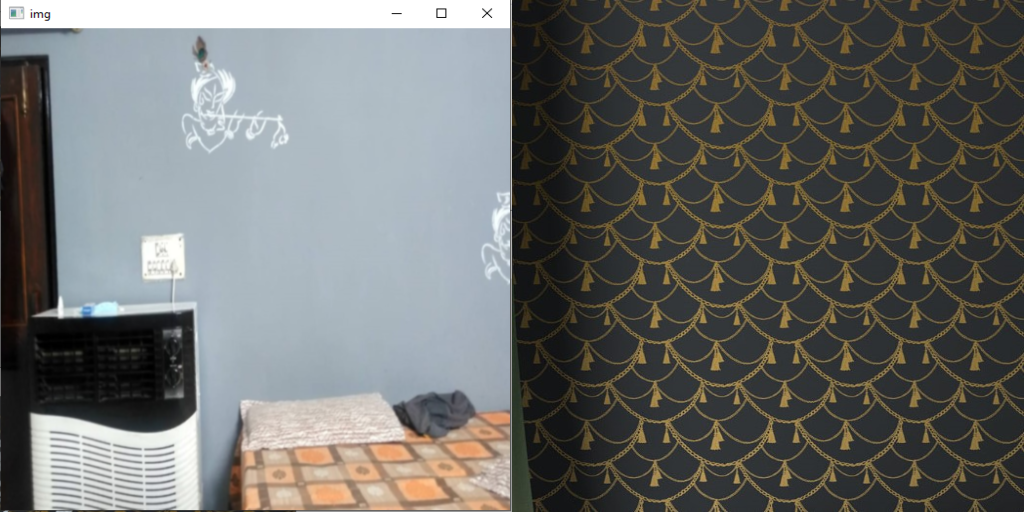
For this article, we will be using the above image and the adjacent pattern. Download here. You can choose whatever images and patterns you like. In this step, what the user has to do, is to left-click on anywhere on the wall and we will grab that pixel value. After that, we will create a range using that pixel by adding and subtracting 10 from each channel.
2. As you may know, colours that look similar to us, may have slightly different pixel values. So, if you think using the pixel value in the above step is enough, you’re wrong. Suppose the pixel value we grabbed is (185, 177, 164). The neighbour’s pixel value could be (186, 177, 164). So, instead, we have created a range of values in which the colour could be present. To make the task more reliable, we will use trackbars to find the correct thresholding value. We can move the trackbars later to find the best values for thresholding and create our mask.
def nothing(x):
        pass
def resize(img):
	return cv2.resize(img,(512,512))
cv2.namedWindow('Tracking')
# creating track bars
cv2.createTrackbar('LH','Tracking',0,255,nothing)
cv2.createTrackbar('LS','Tracking',0,255,nothing)
cv2.createTrackbar('LV','Tracking',0,255,nothing)
cv2.createTrackbar('UH','Tracking',255,255,nothing)
cv2.createTrackbar('US','Tracking',255,255,nothing)
cv2.createTrackbar('UV','Tracking',255,255,nothing)
# Setting trackbar orignial position to lower bound(lb) and upper bound(ub)
cv2.setTrackbarPos("LH",'Tracking',lb[0])
cv2.setTrackbarPos("LS",'Tracking',lb[1])
cv2.setTrackbarPos("LV",'Tracking',lb[2])
cv2.setTrackbarPos("UH",'Tracking',ub[0])
cv2.setTrackbarPos("US",'Tracking',ub[1])
cv2.setTrackbarPos("UV",'Tracking',ub[2])
print("Move the meters, q for next")
while True:
        # getting trackbar position
        l_h=cv2.getTrackbarPos('LH','Tracking')
        l_s=cv2.getTrackbarPos('LS','Tracking')
        l_v=cv2.getTrackbarPos('LV','Tracking')
        u_h=cv2.getTrackbarPos('UH','Tracking')
        u_s=cv2.getTrackbarPos('US','Tracking')
        u_v=cv2.getTrackbarPos('UV','Tracking')
        lb=np.array([l_h, l_s, l_v])
        ub = np.array([u_h,u_s,u_v])
        mask = cv2.inRange(hsv, lb, ub)
        cv2.imshow("mask",resize(mask))
        cv2.imshow("img", resize(img))
        key = cv2.waitKey(1)
        if key==113:
                break
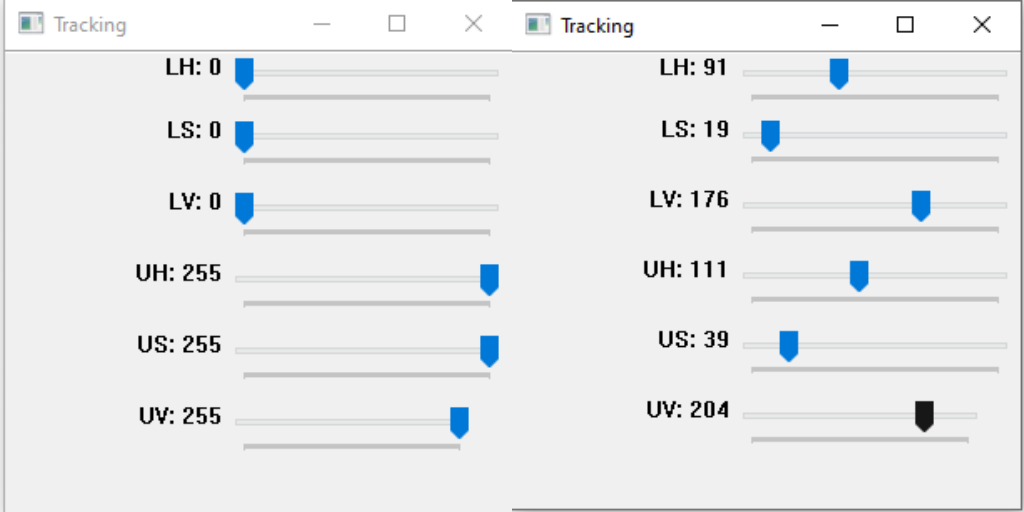
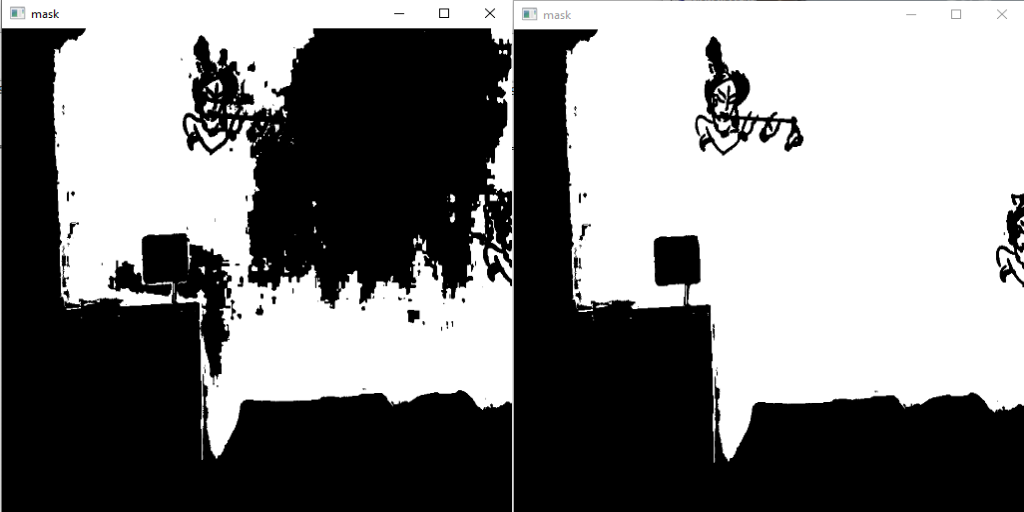
We set the lower and upper bound values calculated in step1 and the results are as above(left image). Clearly, some pixels still go out of range. For that, we will be using the trackbars we created, to manually adjust the values. For my case, slightly increasing the UV trackbar was enough. You can see the results in the right image. I have also attached the thresholding values that I used by myself.
3. In case, thresholding doesn’t give good results, we can create another function that will allow us to draw on the mask image. We can manually draw on our mask image, to improve it. For this, we will be creating another mouse event click_event. click_event() uses a variable ‘draw’ that has three modes. 0, when we don’t want to draw and we are just moving the cursor here and there, 1 for drawing positive mask(white color) using the left mouse button, and 2 for drawing negative mask(black color) using the right mouse button.
draw = 0 # 0->no draw, 1-> +mask, 2-> -mask
def click_event(event, x, y , flags, param):
        global draw, mask
        if event==cv2.EVENT_LBUTTONDOWN:
                draw = 1
        elif event==cv2.EVENT_RBUTTONDOWN:
                draw = 2
        elif event==cv2.EVENT_MOUSEMOVE:
                if draw == 1:
                        cv2.circle(mask,(x,y),10, (255), -1)
                elif draw == 2:
                        cv2.circle(mask,(x,y),10, (0), -1)
                cv2.imshow('mask',mask)
                cv2.waitKey(1)
        elif event== cv2.EVENT_LBUTTONUP:
                draw = 0
        elif event==cv2.EVENT_RBUTTONUP:
                draw = 0
mask = cv2.inRange(hsv, lb, ub)
cv2.imshow("mask",mask)
cv2.setMouseCallback('mask', click_event)
cv2.imshow("mask",mask)
cv2.waitKey(0)
cv2.destroyAllWindows()
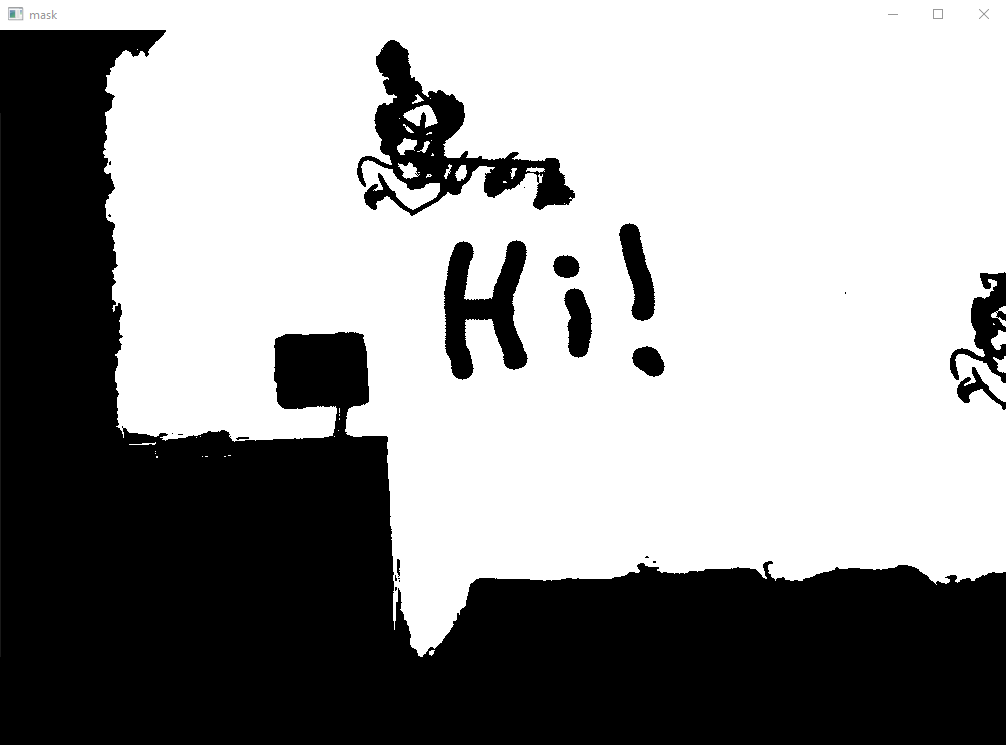
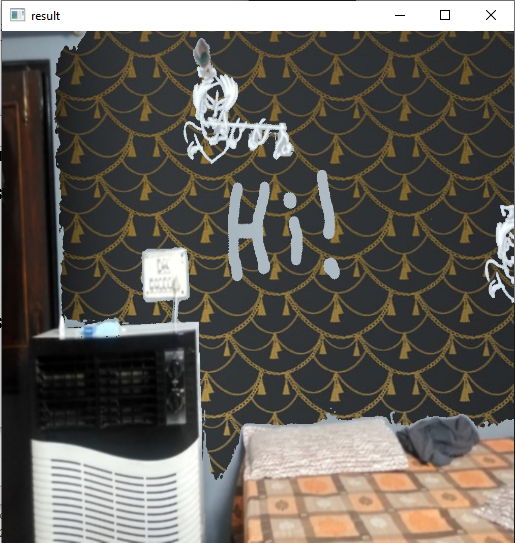
Sorry for my little creativity on the wall, but I hope you understand what’s the purpose. We can choose what region to include in the mask and what to exclude.
4. Now our mask image is ready. Most of the work is done and the magic is about to happen. We will use the texture image and apply the mask on it using the cv2.bitwise_and() function. This will only give us the modified wall. Next, we will invert the mask and apply that to our input image. So, we have one image with a modified wall and one with everything except the wall. Now the last step is adding both these images, and abra Kadabra, our result is ready.
tex = cv2.bitwise_and(tex, tex, mask=mask)
mask_i = cv2.bitwise_not(mask)
img = cv2.bitwise_and(img,img,mask=mask_i)
res = tex+img # our final image
To get a better understanding, you can use cv2.imshow() to see the texture(tex) and image(img) part separately, before adding them using cv2.bitwise_and().
In the end, our code will look like this.
import cv2
import numpy as np

draw = 0 # 0->no draw, 1-> +mask, 2-> -mask
def nothing(x):
        pass
def resize(img, size=(512,512)):
        img2 = cv2.resize(img,size)
        return img2
# grab the color of the wall and provide the lower and upper value
def click_event1(event, x, y , flags, param):
        global draw, mask, lb, ub
        if event==cv2.EVENT_LBUTTONDOWN:
                print("RGB: ",img[y,x], "HSV: ", hsv[y,x])
                lb = hsv[y,x]-10
                ub = hsv[y,x]+10
def click_event(event, x, y , flags, param):
        global draw, mask
        if event==cv2.EVENT_LBUTTONDOWN:
                draw = 1
        elif event==cv2.EVENT_RBUTTONDOWN:
                draw = 2
        elif event==cv2.EVENT_MOUSEMOVE:
                if draw == 1:
                        cv2.circle(mask,(x,y),10, (255), -1)
                elif draw == 2:
                        cv2.circle(mask,(x,y),10, (0), -1)
                cv2.imshow('mask',mask)
                cv2.waitKey(1)
        elif event== cv2.EVENT_LBUTTONUP:
                draw = 0
        elif event==cv2.EVENT_RBUTTONUP:
                draw = 0
cv2.namedWindow('Tracking')
cv2.createTrackbar('LH','Tracking',0,255,nothing)
cv2.createTrackbar('LS','Tracking',0,255,nothing)
cv2.createTrackbar('LV','Tracking',0,255,nothing)
cv2.createTrackbar('UH','Tracking',255,255,nothing)
cv2.createTrackbar('US','Tracking',255,255,nothing)
cv2.createTrackbar('UV','Tracking',255,255,nothing)
img = cv2.imread("room2.jpeg") # room image
tex = cv2.imread("tex2.jpg") # pattern
# https://www.feathr.com/wp-content/uploads/maximalist-living-room-wallpaper.jpg
img = cv2.GaussianBlur(img,(5,5),0)
print("img shape - ",img.shape)
hsv = cv2.cvtColor(img, cv2.COLOR_BGR2HSV)
# gray = cv2.cvtColor(img,cv2.COLOR_BGR2GRAY)
cv2.imshow("img",img)
cv2.setMouseCallback('img', click_event1)
print("Select your wall. Press any key for next")
################ select wall ###########
cv2.waitKey(0)
cv2.setTrackbarPos("LH",'Tracking',lb[0])
cv2.setTrackbarPos("LS",'Tracking',lb[1])
cv2.setTrackbarPos("LV",'Tracking',lb[2])
cv2.setTrackbarPos("UH",'Tracking',ub[0])
cv2.setTrackbarPos("US",'Tracking',ub[1])
cv2.setTrackbarPos("UV",'Tracking',ub[2])
print("Move the meters, q for next")
while True:
        l_h=cv2.getTrackbarPos('LH','Tracking')
        l_s=cv2.getTrackbarPos('LS','Tracking')
        l_v=cv2.getTrackbarPos('LV','Tracking')
        u_h=cv2.getTrackbarPos('UH','Tracking')
        u_s=cv2.getTrackbarPos('US','Tracking')
        u_v=cv2.getTrackbarPos('UV','Tracking')
        lb=np.array([l_h, l_s, l_v])
        ub = np.array([u_h,u_s,u_v])
        mask = cv2.inRange(hsv, lb, ub)
        cv2.imshow("mask",resize(mask))
        cv2.imshow("img", resize(img))
        key = cv2.waitKey(1)
        if key==113:
                break
print("lb and ub",lb, ub)
mask = cv2.inRange(hsv, lb, ub)
# red =np.zeros(img.shape, np.uint8) # In case you want single color
# red[:,:,1] = 255 # replace me with any color
tex = cv2.resize(tex, (img.shape[1],img.shape[0]))
cv2.setMouseCallback('mask', click_event)
# cv2.imshow("texture",tex)
# print(tex.shape)
print("Paint your mask, if you need to. press any key for next")
####### mask breakpoint ##########
cv2.waitKey(0)
tex = cv2.bitwise_and(tex, tex, mask=mask)
mask_i = cv2.bitwise_not(mask)
img = cv2.bitwise_and(img,img,mask=mask_i)
res = tex+img
cv2.imshow("result",resize(res))
print("Thank you !!!")
cv2.waitKey(0)
cv2.destroyAllWindows()
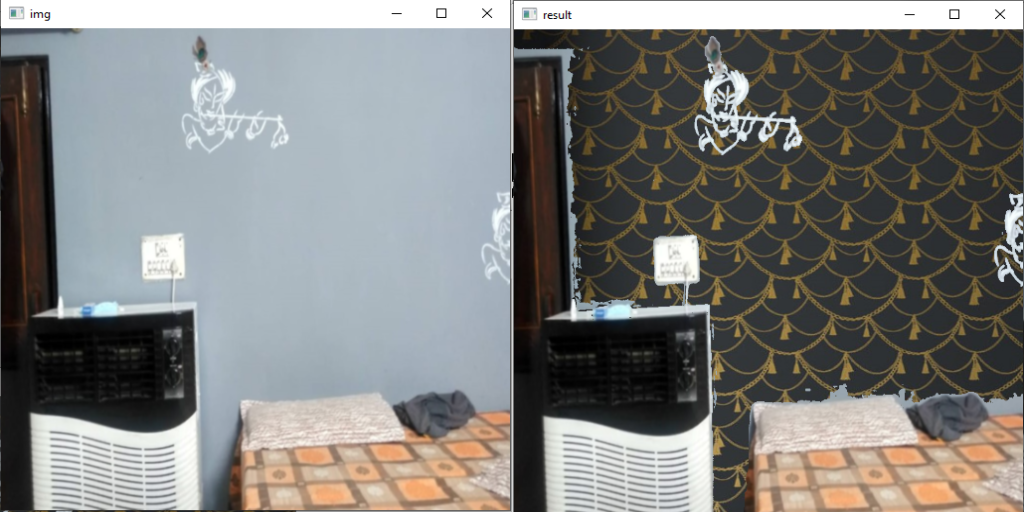
You can see the progress we made from the above image.
Where to go from here?
Congrats, you have created your first visualizer. You must be excited about your next project. Although, if you want, you can work on some improvements in this one too. You may have noticed, the results are not very best and there is still scope for improvement here.
Firstly, you can think of something to get a better range of upper and lower bounds, instead of adding some random value. You can do some preprocessing too. I have used cv2.GaussianBlur(), for preprocessing and it really gave a better mask. Try using with and without it yourself. You can also try some more techniques that could impact the results.
Try on a variety of examples. Mention any issues or suggestions in the comments section. Hope this article motivated you a little.


