Proportionally Speaking
As data sensemakers, we spend a great deal of time examining quantitative relationships. Along with distribution, correlation, and time-series relationships, proportion is the other quantitative relationship that plays a significant role in data sensemaking. A proportion is just a relationship between two quantities. If we compare the number of friends that Sally and John each have, Sally’s 20 friends compared to John’s 10 friends is a proportion. It’s really that simple, but confusion often occurs when we communicate proportions.
Much of the confusion probably stems from the fact that proportions can be expressed in several ways: as ratios, fractions, rates, and percentages. The proportion of Sally’s 20 friends compared to John’s 10 can be written as a ratio in either of the following ways: “20 to 10” or “20:10”. This same proportion can also be expressed as “2 to 1” or “2:1”, for these ratios represent the same proportion in which the first value is double the second. This proportion can also be expressed as the fraction “20/10”. The symbol for division (i.e., /) that appears in the fraction indicates that a proportion can also be expressed as the result of division, which is called the rate. In this case, the rate of Sally’s friends to John’s is 2, because 20 divided by 10 equals 2. A rate of 1, expressed as a percentage, is 100%, so the proportion of Sally’s friends to John’s, expressed as a percentage, is 200% (i.e., the rate of 2 multipled by 100%).
All of these expressions of the proportion reveal that Sally has twice as many friends as John. Expressed as a percentage, we could also say that Sally has 100% more friends than John, for Sally’s 200% minus John’s 100% results in a 100% difference. We should express it this way cautiously, however, for people often find “less than” or “greater than” expressions of proportions confusing. When we express a greater than or less than proportion, we must remember to express only the difference between the two values.
Each expression of the proportion above treats Sally’s friends as the point of reference. To get the rate of 2, we began with Sally’s number of friends and divided that by John’s number of friends (i.e., 20 / 10 = 2). The order matters. If we instead treated John’s number of friends as the point of reference, we could express the proportion of John’s 10 friends to Sally’s 20 in each of the following ways: the ratio 10 to 20, 10:20, 1 to 2, or 1:2; the fraction 10/20 or 1/2; the rate of 0.5; the percentage 50%. We could also say that John has 50% fewer friends than Sally (i.e., John’s 50% minus Sally’s 100% equals -50%).
If John lost 8 of his friends, leaving only 2, while Sally maintained all 20 of her friends, we could say that John has 0.1 or 10% the proportion of friends that Sally has. This is fairly straightforward and clear to anyone who understands the basic concepts of rates and percentages. On the other hand, would could also say that John has 90% fewer friends than Sally (10% minus 100% equals -90%), but, as I warned previously, this isn’t nearly as straightforward and clear for many people.
In the Oxford English Dictionary (OED), the first two definitions of “proportion” are:
1. A portion, a part, a share, especially in relation to a whole; a relative amount or number.
2. A comparative relation or ratio between things in size, quantity, number, etc.
Both of these definitions fit what we’re discussing here. The sixth definition that appears in the OED, however, which is particular to mathematics, can lead to confusion.
6. MATH. A relationship of equivalence between two pairs of quantities, such that the first bears the same relation to the second as the third does to the fourth.
In other words, when comparing the ratio 1:2 to the ratio 10:20, mathematicians would not just say that they are in proportion but that they actually are a proportion. I mention this only to point out that, if you’re talking to a mathematician about proportions, you might be using the term differently, so be careful. I’ve encountered this problem myself a few times.
A few months ago, I ran across an example of a proportion gone wrong. It appeared on the PBS Newshour broadcast on September 23, 2019 in a segment titled “Judges weigh Trump’s family planning finding rule.” Near the end of the broadcast the following text appeared on the screen:
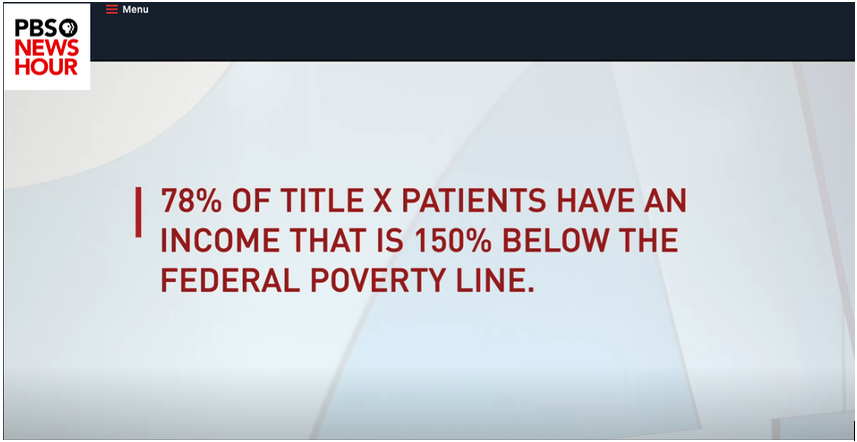
This is an example of a proportion that has been expressed as the difference between two values (i.e., the average income of Title X patients minus the income that’s defined as the poverty level) rather than more clearly as the relationship between them, but that’s not the only problem here. An income that is 150% below the poverty line makes no sense. An income can’t be more than 100% below the poverty line, for that would produce a negative value and negative income doesn’t make sense in this context. The person who wrote this text must not understand proportions, and apparently the program’s hosts were confused as well, which is all too common. I suspect that they meant to say that 78% of Title X patients have incomes that fall below 150% of the poverty line. In 2019, the U.S. federal poverty level for a family of one was $12,140, so 150% of that is $18,210. It seems reasonable that 78% of people who take advantage of Title X—people who tend to have low incomes and thus are in need of Title X assistance—made less than $18,210 for a family of one, $24,690 for a family of two, $31,170 for a family of three, and so on.
When dealing with proportions, a rate of 1 and a percentage of 100% play an important role. They both express the same equal, one-to-one proportion. In other words, the two values that are being compared are the same. For this reason, we tend to think of proportions as being less than, equal to, or greater than 1 when expressed as a rate or less than, equal to, or greater than 100% when expressed as a percentage. Consistent with the importance of 100%, there is a special type of proportional relationship that is based on 100% of something: the part-to-whole relationship. The whole is 100% of some measure (e.g., total sales revenues) and the parts are lesser percentages into which the whole has been divided (e.g., sales revenues in separate geographical regions, consisting of North, South, East, and West), which add up to 100%. When examining parts of a whole, we spend much of our time comparing the parts to one another. As such, graphical displays of part-to-whole relationships are only effective if they make it easy to compare the parts. Unfortunately, the most popular part-to-whole display—the pie chart—does this job poorly. It is difficult to compare slices of a pie. If you don’t already know why this is so, I recommend that you read my article “Save the Pies for Dessert.” As it turns out, this problem with pie charts is well understood but routinely ignored.
The ways that changes in proportions are expressed are another common source of confusion. Let me illustrate. According to a recent survey, the obesity rate among U.S. adults is now 42%. If we’re told that the obesity rate has increased 40% in the last 20 years, what was the rate in the year 2000? Think about this for a moment. In the year 2000, was the obesity rate 2% (i.e., 2% + 40% = 42%) or was it 30% (i.e., 30% * 140% = 42%)? It depends on how you interpret the words “increased 40%.” People sometimes mistakenly interpret this as a percentage point increase rather than a percentage increase. In this particular case, common sense suggests that the obesity rate must have been 30% in the year 2000, for there’s no way that only 2% of U.S. adults were obese just 20 years ago. Without this context, however, people might be confused.
This increase may be expressed in any of the following ways: “From the year 2000 to the year 2020, the obesity rate among U.S. adults…”
- “…increased from 30% to 42%.”
- “…increased 12 percentage points to 42%.”
- “…increased 40% to 42%.”
Which of the three expressions above would least likely result in confusion? I suspect that the first, “…increased from 30% to 42%”, is the clearest. We could, of course, state the change more thoroughly by saying “…increased 12 percentage points from 30% to 42%” or “increased 40% from 30% to 42%.” When communicating with the general public, extra care in expressing changes in proportions works best.
Communicating proportions isn’t terribly difficult if we’re aware of how people might misinterpret them and take care to express them clearly. If you’re proportionally challenged, I hope this helps.